Leveraging autonomous vehicles crash narratives to understand the patterns of parking-related c rashes
Handling editor: Lai Zheng, Harbin Institute of Technology, China
Reviewers: Chuanyun Fu, University of British Columbia, Canada
Petr Pokorny, Institute of Transport Economics, Norway
Received: 20 January 2023; Accepted: 20 June 2023; Published: 5 July 2023
Abstract
Autonomous vehicles (AVs) parking has been a subject of interest from various researchers; however, the focus has been on the parking demand, algorithm, and policies, while the safety aspect has received less attention, perhaps due to the lack of AV crash data. This study evaluated the magnitude and pattern of AV parking-related crashes that occurred between January 2017 and August 2022 in California. The study applied descriptive analysis, unsupervised text mining, and supervised text mining (Support Vector Machine, Naïve Bayes, Logitboost, Random Forest, and Neural network) with resampling techniques. It was indicated that parking-related crashes constitute about 16% of all AV crashes, most of them are likely to impact the AV on the rear or left side. The unsupervised text mining results showed that AVs in the conventional mode of operation, reversing, and parallel parking are among the key themes associated with parking-related crashes. The Support Vector Machine, Logitboost, Random Forest, and Neural network showed relatively high prediction accuracy. The important features from these supervised text mining approaches were conventional mode, reservsing, passenger vehicle, parallel parking, which confirm the preliminary findings in the unsupervised text mining. The implications of the findings to operators and policymakers are included in the study. Findings from this paper could be used to introduce measures to reduce AV parking-related crashes.
Keywords
autonomous vehicles, crash narratives, machine learning, parking-related crashes, text network
Introduction
Autonomous vehicles (AVs) are becoming a reality, with various levels of automation being tested and operating in mixed traffic. Many cities and jurisdictions across the globe have approved AV testing. For instance, in America alone, there are over a hundred AV testing locations, including testing in mixed traffic in California, Arizona, New York, and Nevada, among others (NHSTA, 2022). In addition to the testing, individuals operate AVs of varying levels of automation, as indicated by the most recent statistics of AV penetration in the United States and globally (Statistica, 2022).
As the AVs penetration continues to increase, researchers have shown interest in various aspects, including their safety and operations (Favarò et al., 2018; Khattak et al., 2020; Mahdavian et al., 2019; Morando et al., 2018; Novat et al., 2023; Parsa et al., 2021; Schoettle & Sivak, 2018). Several approaches have been used to assess the safety implications of AVs, including traffic simulation, survey questionnaires, virtual reality, observational studies and analyses of disengagement reports, and AV-involved crash data. Some studies reported that AVs improve road safety by eliminating human errors associated with conventional vehicles (Mahdavian et al., 2019; Morando et al., 2018; Parsa et al., 2021). Other studies revealed that AVs have higher crash rates per million miles than conventional vehicles (Favarò et al., 2018; Pokorny & Høye, 2022; Schoettle & Sivak, 2018). Further analysis showed that AVs were mostly not at-fault, and the severity of crashes involving AVs was lower than the severity of crashes involving conventional vehicles (Mousavi et al., 2020; Schoettle & Sivak, 2018). Even when they were at fault, they were more likely to be in conventional mode (Kutela et al., 2022; Pokorny & Høye, 2022). In recent years, the availability of the crash data involving AVs in California has opened a door for researchers to explore crash characteristics and associated factors (Boggs et al., 2020; Kutela et al., 2022; Xu et al., 2019).
Chan et al. (2021), Lee et al. (2009), Bahrami & Roorda (2022), Hsieh & Özguner (2008), NHSTA (2022), and Nakrani & Joshi (2022) discussed that although there is a significant interest in improving parking-related AV operations and safety, little is known about the scale of parking-related crashes, perhaps, due to the scarcity of actual crash data. However, the availability of crash data involving AVs in California opened doors for numerous research (DMV, n.d). Therefore, this study explores the scale and patterns of parking-related AV crashes. The study intends to answer the following questions: (a) What is the scale of parking-related AV crashes? (b) Do the characteristics of parking-related AV crashes differ from other crashes? (c) What recommendations could be provided from the critical patterns in parking-related AV crashes? Although parking-related crashes are likely to be property damage only, damaged AV features such as sensors may require substantial amount of funds to replace them. Thus, it is important to understand the associated factors in order to reduce the likelihood of such crashes to happen. The remaining part of the manuscript is organized as follows. The next section discusses the literature summary of the studies on the safety effects of AVs, followed by the details on the methodology and data used in the analysis. Results and discussions are then presented followed by the key takeaways and directions for future research.
Literature review
Various researchers have been interested in AV parking from different perspectives (Bahrami & Roorda, 2022; Chan et al., 2021; Lee et al., 2009; Nakrani & Joshi, 2022). A policy-based study, Bahrami and Roorda (2022), indicated that AV users would redirect their vehicles to park at their homes if they had to pay to use a parking facility. The same study revealed that AVs would travel between 12 and 47 minutes in the downtown setting to find cheaper parking. Lee et al. (2009) developed algorithms to solve three parallel-parking issues: trajectory planner, decision kernel, and trajectory tracking control. The algorithms could determine feasible parking locations, alternative parking routes, and re-performing parking routing if the targeted parking space has been occupied. Such operations would save not only time but also improve safety. The algorithms developed by Nakrani & Joshi (2022) would improve safety by avoiding static and moving obstacles. The developed model was simulated, and the results indicated a reasonable performance for parallel parking.
Although AV parking has been of interest, little has been studied using actual crash data involving AVs. A scan of studies that used real AVs crash data from California suggests mixed findings. However, only two studies, Ren et al. (2022) and Xu et al. (2019), have some details regarding parking-related crashes. Almost all studies reported a low proportion of injury crashes for AV-involved crashes (Das et al., 2020; Song et al., 2021). Several studies have extensively studied collisions between AVs and conventional vehicles. Factors like vehicle/personal attributes (driving mode and non-motorized road users), road attributes like parking and lighting, and crash attributes like the manner of collision were considered in previous studies involving AVs. Results from these studies have been summarized in Table 1.
|
Factors |
Category |
Publication |
Summary of results |
|---|---|---|---|
|
Vehicle or personal attributes |
Driving mode |
Most common AV crashes occurred when autonomous mode is engaged. |
|
|
Higher likelihood of AV rear-end crash when autonomous driving system is engaged. |
|||
|
Crashes involving non-motorized users indirectly are more likely to occur when AVs are in autonomous mode. |
|||
|
Autonomous driving mode reduced the risk of non-Property Damage Only (PDO) crashes. |
|||
|
Non-motorized road users |
Bicyclists and scooterists were more likely to be involved in AV crashes directly. |
||
|
Pedestrians were more likely to be involved in VA crashes indirectly. |
|||
|
Road attributes |
Intersections and roundabouts |
Most common AV crashes occurred at an intersection when AVs are stopped. |
|
|
Connected and autonomous vehicle (CAV) involved crashes at intersections were more likely to be PDOs. |
|||
|
AVs reduced the number of conflicts at intersections and roundabouts at specific market penetration rates. |
|||
|
Parking |
Roadside parking increased the severity of CAV-involved crashes. |
||
|
On-street parking increased the severity of AV-involved rear-end crashes. |
|||
|
Lighting |
Dark lighting conditions with streetlights were associated with a higher proportion of injuries. |
||
|
Land use |
Mixed land use increased the severity of crashes involving AVs. |
||
|
AV-involved rear-end crash more likely in mixed land use. |
|||
|
AV-involved rear-end crash less likely near schools. |
|||
|
Built environment |
The presence of trees, were associated with a lower likelihood of severe AV-involved rear-end crashes. |
||
|
Crash attributes |
Types of collision |
The most common AV crashes were rear-end crashes. |
|
|
The most frequent AV pre-crash scenarios were rear-end and lane change collisions. |
|||
|
CAV-involved crashes were more severe than other crash types. |
|||
|
CAV-involved crashes on one-way roads were more likely to be PDOs. |
|||
|
Autonomous mode crashes were more likely to be rear-end. |
|||
|
Tuning, multi-vehicle, rear-end, and sideswipe collisions were associated with a higher proportion of injuries. |
|||
|
The most common sequence involved a collision following AV stop. |
|||
|
Most rear-end crashes involving conventional vehicles bumping into the rear of AVs. |
|||
|
An increase in the market penetration of AVs reduced rear-end and lane-changing conflicts. |
According to Ren et al. (2022), on-street parking is associated with an increased likelihood of severe AV crashes. However, the observation does not indicate that the AV was involved in parking-related crashes. Similarly, Xu et al. (2019) showed that 40% of AV crashes occurred at locations with roadside parking. The authors elaborated that such a high proportion may be due to a limited sight distance. However, this study also did not indicate whether the said proportion of crashes involved parking-related activities.
The literature review shows an attempt to understand various characteristics of AV-involved collisions, including a few studies on parking-related collisions. However, two significant limitations can be observed in the existing studies with regard to parking-related crashes: (i) relatively few studies focused on parking-related crashes applied descriptive analysis and did not evaluate the associated factors; (ii) studies that evaluated the associated factors for AV-involved crashes combined parking and non-parking related crashes. The combined analysis did not show the characteristics of parking-related crashes, making it hard to determine the appropriate measures to reduce such collisions and improve AV safety in parking locations. Therefore, this study investigated factors associated with parking-related crashes involving AVs using supervised and unsupervised text mining.
Methodology
This study used crash narratives to uncover the key patterns among factors associated with parking-related crashes. It applied supervised and unsupervised text mining of crash narratives to understand and distinguish the critical patterns in parking and non-parking-related crashes. Unsupervised text mining involves the use of text network analysis. In contrast, supervised text mining used four classifiers, including Support Vector Machine (SVM), Naïve Bayes (NB), Random Forest (RF), and Neural Network (Nnet).
Text network analysis
Text network analysis (TNA), an unsupervised text mining tool, was utilized to express the interconnectedness between various keywords. Before its use in transportation, the TNA approach had been used extensively in literature and linguistics (Hunter, 2014). TNA has emerged as the preferred text mining approach in solving modern problems due to its ability to reveal and enable visualizations of different topic patterns (Jiang et al., 2020; Paranyushkin, 2012). Other areas where text analysis has been used include traffic safety analysis and operations (Boggs et al., 2020; Kutela et al., 2022; Kutela et al., 2023; Lee et al., 2023) and bibliometrics of transportation studies (Jiang et al., 2020; Kutela et al., 2021; Kutela et al., 2023). In TNA, nodes representing keywords and edges representing connections are used to map unstructured text data. Figure 1 shows a typical text network topology.
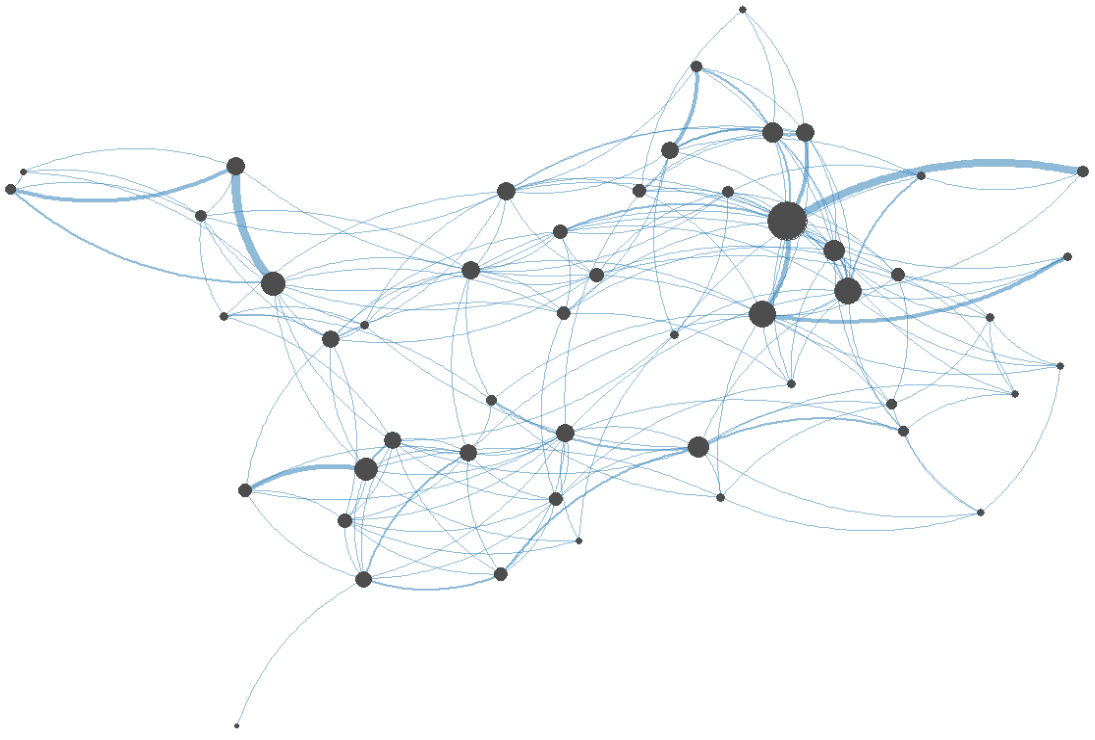
The TNA process starts with data cleaning and converting unstructured to structured data. This process includes removing redundant words and symbols peculiar to the study design and converting upper-case to lower-case letters. The unstructured data is further converted into a matrix of keywords and the frequency of occurrence included in the text data. The resulting text data, which is structured, is mapped to create a text network.
In the network (Figure 1) the node's size represents the frequency of the keyword, while the size of the edge represents the frequency of the co-occurrence of keywords (Kutela et al., 2021). Keywords that appear close in the narratives also appear close in the network. Therefore, to better understand these text network patterns, measures such as ‘keyword frequencies’, ‘co-occurrence frequency’, and ‘collocation frequency’ are used. The collocation frequency provides richer information than co-occurrence frequency as it presents the keywords that appear next to each other (Benoit et al., 2018; Blaheta & Johnson, 2011; Kutela et al., 2022; Novat et al., 2023). In addition, the network topology was used to distinguish the patterns of the parking- and non-parking-related crashes.
Text classifiers
Five supervised machine learning algorithms, including SVM, NB, RF, Logitboost, and Nnet were used to classify parking-related crashes. The ability of these machine learning algorithms to classify parking AV-involved crashes was compared based on Accuracy, Precision, and F-1 score, described in Equation 1, Equation 2 and Equation 3 respectively:
whereby
-
TP: True Positive, actual positive values correctly classified as positive;
-
TN: True Negative, actual negative values correctly classified as negative;
-
FP: False Positive, actual negative values incorrectly classified as positive;
-
FN: False Negative, actual positive values incorrectly classified as negative.
All the classifiers mentioned above use a different approach to classify the crash. Joachims (1998), Pranckevičius & Marcinkevičius (2017) and Yuan et al. (2019) provide detailed information about each classifier. Below is a brief description of each classifier used in this study:
-
SVM is a classifier that uses a hyperplane to separate the classes of documents/data by maximizing the margin between classes' closest points. The algorithm plots all data items as points in n-dimensional space and then finds the hyperplane that best differentiates the two classes of the document/data.
-
NB is a family of probabilistic algorithms based on Bayes theorem and is considered a simple classifier. The primary assumption for NB is that the presence of one feature does not affect other features. By utilizing NB one can obtain the probability of observing certain outcomes, given that specific predictors were observed.
-
RF classifier works by establishing and aggregating predictions from several individual decision trees of varying depths, which works as an ensemble. It searches for the best feature from random decision trees to improve classification accuracy.
-
Nnet algorithm is inspired by the biological neural network, which imitates the human brain learning process. The Nnet classifier uses documents as input nodes and assigns features weight to its input until the final classification is reached. Then, it uses backpropagation, which implies that misclassified cases are propagated back using neural networks trying to identify the node that caused the error. After the node has been identified, the weights are added to minimize the error.
-
Logitboost is a boosting classification algorithm that strives to obtain the optimum classifiers by fitting an additive model that minimizes a logistic loss.
Data processing
The dataset used for this study is obtained from crash narratives. The dataset is further classified into parking- and non-parking-related AV crashes. The parking-related AV crashes included all crashes with at least one vehicle (both AV or at least one AV and one conventional car) involved in a crash when parking or already parked. Before classifying the dataset, all parking-related terms were removed. This process was necessary to ensure that the algorithm could easily classify parking-related crashes without the presence of crucial parking terms like parked, parking, and reversing. This method is consistent with an approach used by Arteaga et al. (2020) when analyzing the injury severity of crashes using an interpretable text-mining approach.
Since AV parking-related crashes constitute a small proportion (about 14.4%) of all AV-involved crashes, the issue of class imbalance might arise. To address this, three resampling algorithms—SMOTE, over-sampling, and under-sampling (Kitali et al., 2019)—were considered to take care of class imbalance. In addition, resampling techniques like cross-validation and bootstrap approaches were used to increase the sample size (Kitali et al., 2019). From observations, it was realized that the combination of under-sampling and bootstrap yielded models with reasonable classification accuracy. Different proportions of training and testing data sets were examined in the quest for the ratio that yields a higher score. Finally, predictions were obtained based on a model developed using 70% of the data for training and 30% for testing. The features used for classifying parking-related crashes were developed from the text data using standard text conversion procedures. The conversion procedures involve cleaning, generating n-gram features, and generating a document matrix (Kwayu et al., 2020). Concerning cleaning the data, unstructured text was converted into the corpus. Also, punctuation, symbols, numbers, and stemming (i.e. reducing a word-to-word root) were removed. On the other hand, generating a document matrix covers determining each n-gram and converting the corpus to the document matrix. The document matrix was then used for AV parking-involved crash classification tasks.
Study data
The State of California has been testing AVs in mixed traffic since 2014. The AVs operating in California roadways vary by the levels of automation, whereby the lowest level is ADAS level 2, and the highest is level 4. The state requires any crash involving AV to be reported within ten days. Although crash data has been collected, crashes that occurred before 2017 were not well documented. Thus, this study used 460 AV crashes collected by the California Department of Motor Vehicles (CDMV) between January 2017 and June 2022.
Vehicle operators submit crash reports that contain the crash narratives to the CDMV in pdf format. Based on these narratives, several variables were manually extracted, including the location and time of crashes, the directional movement of the AV and CV (connected vehicle), and the type of driving mode during the collision. Google Maps was also employed to get other roadway-related variables by following the address provided in the crash report.
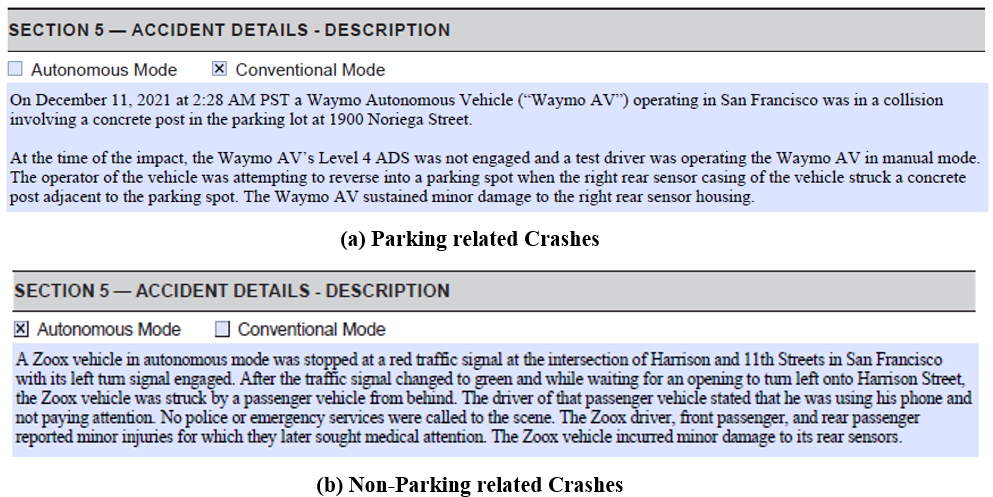
To obtain crash location information, section 5 of the crash report (Figure 2) was used. The narratives clearly state the location of the crash. For instance, part of the narrative in Figure 2a states that ‘On December 11, 2021, at 2:28 am PST a Waymo Autonomous Vehicle (Waymo AV) operating in San Francisco was in a collision involving a concrete post in the parking lot at 1900 Noriega Street...’. The narrative suggests that the crash occurred at the parking lot. Thus, it is a parking-related crash. On the other hand, a portion of the narrative in Figure 2b states that ‘...a Zoox vehicle in autonomous mode was stopped at a red traffic signal at the intersection of Harrison and 11th Streets in San Francisco with its left turn signal engaged. After the traffic signal changed to green and while waiting for an opening to turn left onto Harrison Street, the Zoox vehicle was struck by a passenger from behind…’, suggesting that the crash was at an intersection.
Non-parking related crashes: descriptive summary
Overall, among 460 crashes, 15.7% (72 crashes) were parking-related crashes. Figure 3 shows the distribution of AV crashes during the period under consideration (2017–2022). The number of parking-related and non-parking-related crashes significantly differed over the years. The total number of AV crashes over the years shows an upward trend except in 2020. Also, the highest number of crashes was recorded in 2022 (23.9% of the total), while 2020 recorded the lowest number (9.3% of the total). This could be attributed to COVID-19 and the lower number of trips recorded nationally in 2020. The 12 parking-related crashes in 2020 represent the highest proportion (28%) of parking-related crashes per year, while in 2017, no parking-related crashes were observed. Although the year has not ended, the statistics suggest that 2022 might record the most significant number of parking-related crashes.
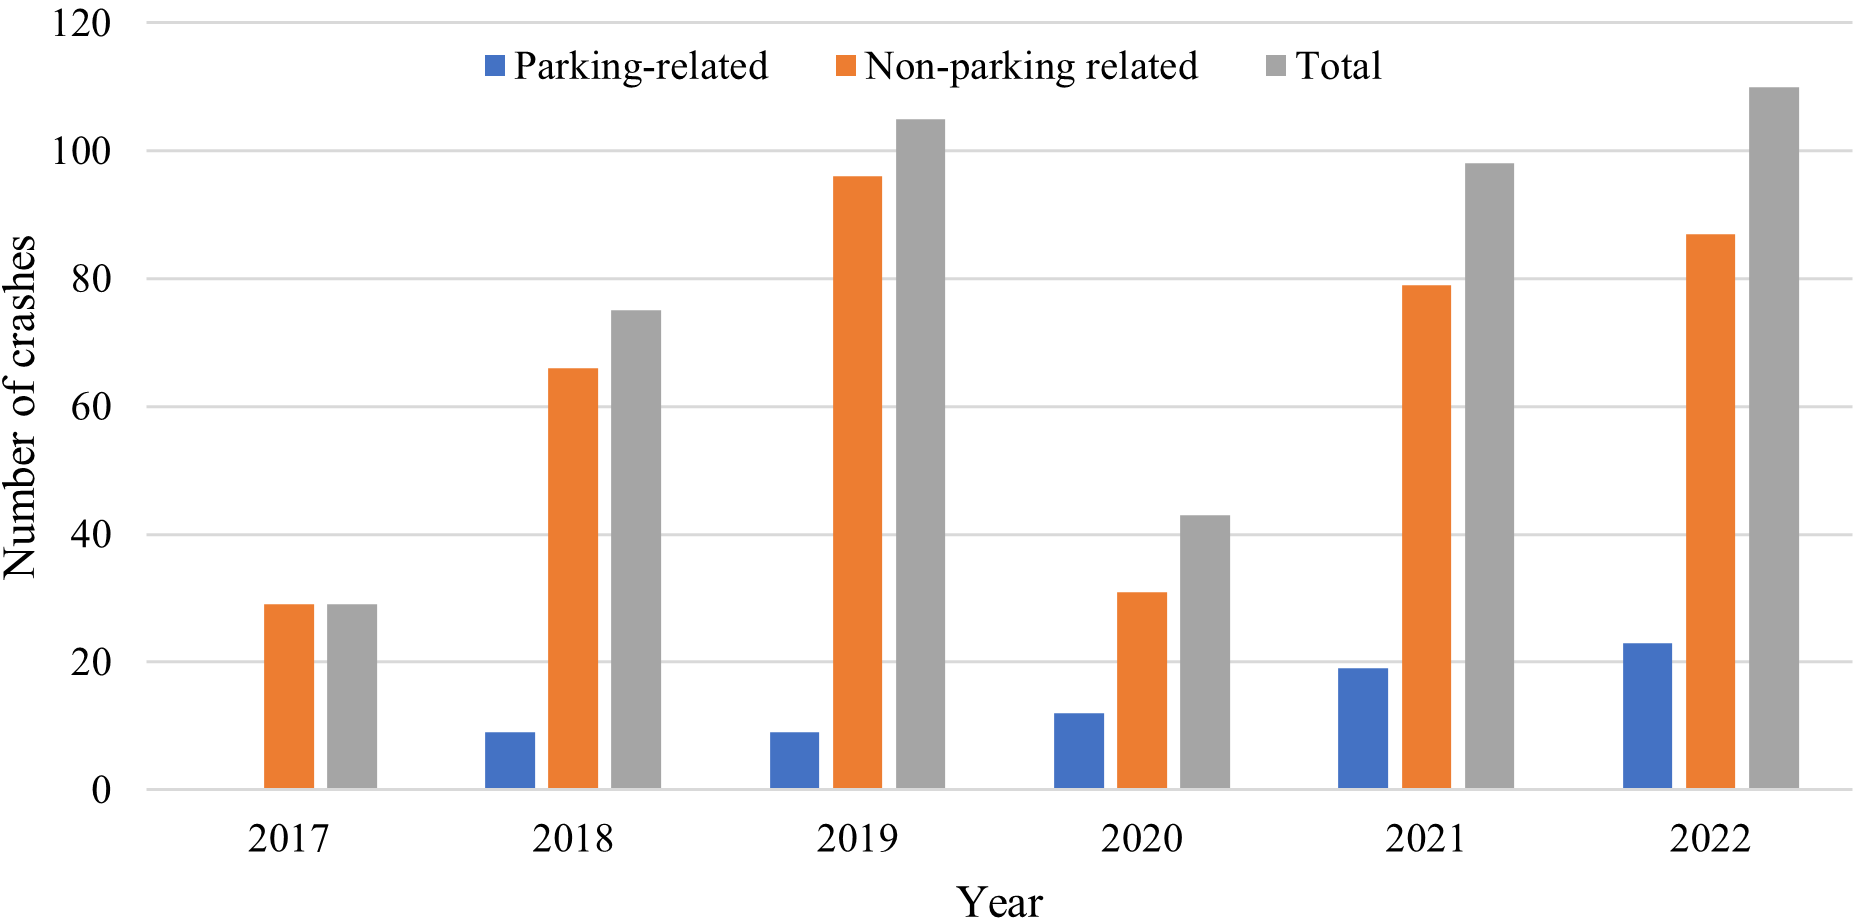
Figure 4 shows the number of crashes at different times of the day. For both parking and non-parking-related crashes, significant peaks were observed between 8:30 am and 9:30 am and between 3:30 pm and 4:30 pm. The parking-related crashes follow a similar trend to the non-parking-related crashes, except for the early night period (8:00 pm to midnight).

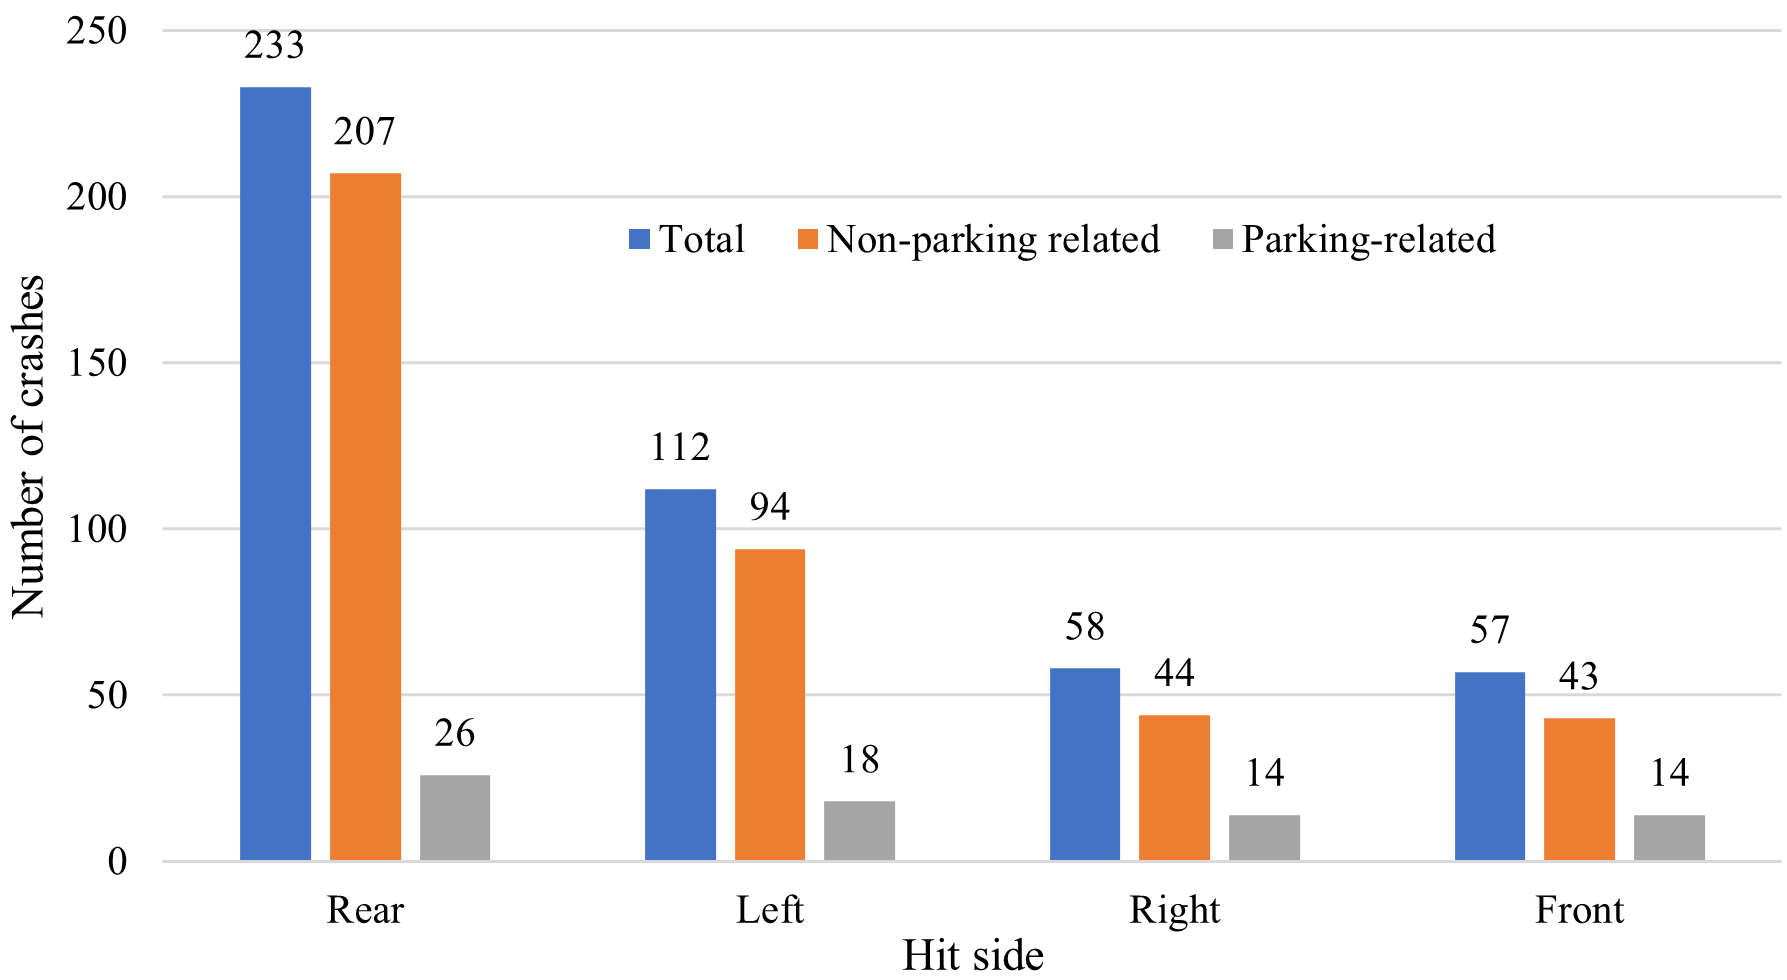
Collisions involving the rear of AVs constituted about 50.7% of the total crashes, as shown in Figure 5. This finding is in line with previous studies showing rear-end collisions as significant in AVs (Ashraf et al. 2021; Liu et al. 2021). Other hit sides are the left side (24.3%), right side (12.6%), and front side (12.4%). While most non-parking-related crashes involved the rear side of the AVs, the distribution of parking-related crashes is relatively similar across the sides of the AVs. Such observation strengthens the importance of characterizing parking-related crashes because non-parking-related crashes can overshadow latent characteristics.
Results and discussion
This section presents the results and discussion of this study. It is divided into two major subsections: text mining and discussion, and model results and discussion. The text mining part presents the results and discussion from the text mining, while the model section avails the results and discussion from the statistical models.
Text networks results
The networks results and discussion covers the discussion on parking-related and non-parking-related crashes. The discussion is based on text networks' metrics, including keywords frequency, co-occurrences, and collocations
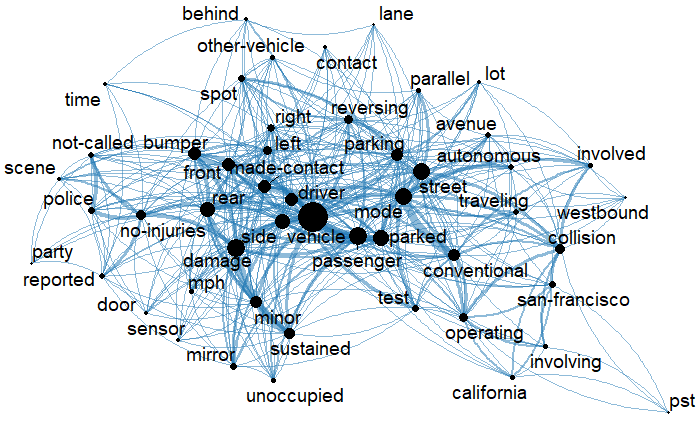
Parking-related crashes
Table 2 and Figure 6 show the text network and main keywords associated with AV crashes at parking spaces. It was found that the significant keywords include vehicle, mode, parked, passenger, damage, street, and rear. The keywords connected to vehicle indicated that crashes were likely to involve passenger vehicles. Also, the keyword vehicle was connected to the keyword unoccupied using thick lines, meaning that there were no occupants in parked vehicles involved in the crashes. Unlike non-parking related crashes, the node for keyword conventional was more significant than for keyword automated. This implied that AVs involved in crashes at parking locations were more likely to be in conventional than autonomous mode. As expected, parking and parked were other major keywords in the network, alluding to crashes in parking zones or parking lots. The size of the node for keyword parallel was more significant than the keyword lot, indicating a higher likelihood of crashes involving AVs in on-street parking spaces than in parking lots.
The keyword damage was highly connected to keywords side, mirror, door, minor, and no injuries. Contrary to the non-parking related crashes, it was revealed that the AV crashes in parking locations were likely to cause damage to the side mirrors. The network revealed that the parking crashes might also involve door damage. Moreover, the keywords minor and no-injuries indicate the severity of these crashes. As a result, police are not called or engaged in most of these crashes. The rear and its related keywords, including made contact, bumper, front, and left, indicate the nature of the collisions in parking lots. They are also supported by keyword reversing, which suggests a common vehicle movement when parking. It could therefore mean crashes are more likely to involve contact between the front and rear bumpers when a driver reverses to get into or out of the parking spot. However, it is unclear what the keywords left and right imply in crashes involving AVs at parking locations. It is important to note that crashes at parking locations were less likely to affect non-motorized users, as proven by the absence of keywords such as bicyclists or pedestrians. Moreover, lighting was not among the network keywords indicating the insignificance effect of lighting on AV crashes at parking locations.
|
Frequency |
Co-occurrences |
Collocations |
||||||
|---|---|---|---|---|---|---|---|---|
|
freq* |
docfreq* |
count |
count |
Z-score |
||||
|
1 |
Mode |
80 |
64 |
Passenger vehicle |
64 |
Passenger vehicle |
48 |
15.3 |
|
2 |
Damage |
65 |
52 |
Conventional mode |
54 |
Minor damage |
35 |
13.7 |
|
3 |
Vehicle |
120 |
48 |
Parked vehicle |
49 |
No-injuries police |
22 |
12.9 |
|
4 |
Conventional |
54 |
47 |
Minor damage |
39 |
Operating conventional |
18 |
11.6 |
|
5 |
Made-contact |
47 |
45 |
Damaged vehicle |
37 |
No-injuries reported |
18 |
11.6 |
|
6 |
No-Injuries |
44 |
44 |
Vehicle made contact |
35 |
Operating san-francisco |
17 |
11.3 |
|
7 |
Street |
79 |
41 |
Vehicle bumper |
30 |
Rear bumper |
18 |
11.3 |
|
8 |
Parked |
62 |
38 |
Front bumper |
30 |
Sustained minor |
32 |
11.2 |
|
9 |
Rear |
56 |
38 |
Police not-called |
29 |
Test driver |
25 |
11.0 |
|
10 |
Collision |
39 |
37 |
Front vehicle |
28 |
Police not-called |
29 |
10.8 |
|
11 |
Minor |
42 |
35 |
Damage bumper |
28 |
Front bumper |
15 |
10.6 |
|
12 |
Driver |
52 |
33 |
Rear bumper |
27 |
Reported scene |
10 |
10.4 |
|
13 |
Parking |
48 |
32 |
Rear damage |
27 |
Involved collision |
19 |
9.8 |
|
14 |
Not-Called |
32 |
32 |
Autonomous mode |
27 |
San-Francisco California |
13 |
9.6 |
|
15 |
Bumper |
45 |
31 |
Parked street |
26 |
Vehicle sustained |
17 |
9.3 |
|
16 |
Operating |
42 |
31 |
Test driver |
25 |
Parked vehicle |
20 |
8.9 |
|
17 |
Police |
31 |
31 |
Side vehicle |
25 |
California collision |
13 |
8.9 |
|
18 |
Reversing |
34 |
29 |
Parking spot |
25 |
Mode involved |
12 |
8.7 |
|
19 |
Side |
51 |
28 |
Parked side |
25 |
pm PST |
6 |
8.7 |
|
20 |
Front |
45 |
28 |
Parking reversing |
23 |
Damage front |
12 |
8.6 |
*freq = frequency; docfreq = document frequency
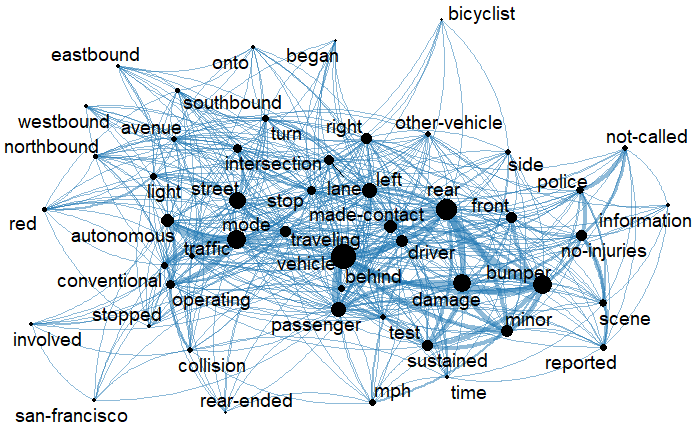
Non-parking related crashes
Figure 7 and Table 3 present the text network and associated main keywords for crashes involving AVs at non-parking locations (intersections and non-intersections). It can be observed that eight primary keywords, vehicle, mode, rear, bumper, damage, passenger, autonomous, and street stand out from Figure 7. The network suggests that passenger vehicles were crucial participants in non-parking-related crashes involving AVs. This might be true since autonomous vehicles usually operate in urban locations where passenger vehicles dominate. The non-parking text network indicated that AVs operated more in autonomous mode than in conventional mode. This finding is opposite to results found in parking-related crashes. This inference was made by comparing the node sizes of autonomous and traditional keywords in text networks of both parking- and non-parking-related crashes. The thick line between the keywords autonomous and mode indicates that the vehicle was operating in autonomous mode.
The node size of the keyword rear was more significant than the keywords front and left. The keyword rear appeared in 375 observations, while front and left were reported in 205 and 306 observations, respectively. The keyword rear was mainly connected to the keywords bumper, damage, made-contact, and minor bumper, damage, and minor. These keywords are indicative of most crashes involving AVs at non-parking locations being rear-ended collisions. The thick lines between these keywords reveal that damage associated with rear-end crashes is likely minor when contacts are being made with the rear bumper. In addition, it was revealed that rear bumper and rear damage were among the most co-occurring words suggesting that crashes at non-parking locations were mainly rear-ending collisions. Similar to parking-related crashes, thick lines between the keywords no-injuries, not-called, police, and scene imply that police were likely not called in crashes not involving injuries. In contrast to parking-related crashes, the presence of the keyword bicyclist reveals that AVs are likely to be involved in crashes with non-motorized vehicles in non-parking locations.
|
Frequency |
Co-occurrences |
Collocations |
||||||
|---|---|---|---|---|---|---|---|---|
|
freq * |
docfreq* |
count |
count |
Z-score |
||||
|
1 |
Mode |
451 |
353 |
Autonomous mode |
314 |
Rear bumper |
186 |
35.7 |
|
2 |
Automated |
317 |
253 |
Rear bumper |
289 |
Passenger vehicle |
203 |
33.0 |
|
3 |
Damage |
313 |
244 |
Passenger vehicle |
247 |
Minor damage |
155 |
30.6 |
|
4 |
Rear |
375 |
241 |
Rear damage |
212 |
Sustained minor |
131 |
30.5 |
|
5 |
No-Injuries |
238 |
238 |
Damage sustained |
192 |
No-injuries police |
104 |
29.7 |
|
6 |
Made-contact |
232 |
227 |
Made contact rear |
191 |
No-injuries reported |
103 |
29.5 |
|
7 |
Vehicle |
525 |
216 |
Operating mode |
186 |
Operating automated |
109 |
29.0 |
|
8 |
Operating |
238 |
216 |
Vehicle damage |
184 |
Made-contact rear |
104 |
26.9 |
|
9 |
Police |
214 |
204 |
Rear vehicle |
176 |
Test driver |
88 |
26.4 |
|
10 |
Driver |
273 |
197 |
Rear bumper |
163 |
Reported scene |
61 |
24.4 |
|
11 |
Bumper |
308 |
195 |
Bumper sustained |
149 |
Left turn |
71 |
23.7 |
|
12 |
Left |
306 |
189 |
Conventional mode |
148 |
Autonomous mode |
309 |
23.4 |
|
13 |
Traveling |
258 |
177 |
Rear sustained |
137 |
Red light |
61 |
23.2 |
|
14 |
Street |
373 |
172 |
Minor rear |
137 |
Mode traveling |
85 |
22.5 |
|
15 |
Stop |
234 |
168 |
Traveling mode |
134 |
Damaged front |
67 |
22.3 |
|
16 |
Not-called |
158 |
158 |
Operating automated |
129 |
Conventional mode |
140 |
22.2 |
|
17 |
Front |
205 |
157 |
Minor sustained |
128 |
Operating conventional |
56 |
21.9 |
|
18 |
Scene |
177 |
157 |
Intersection street |
119 |
Police not-called |
151 |
21.8 |
|
19 |
Right |
230 |
147 |
Traveling street |
115 |
Damage rear |
78 |
21.2 |
|
20 |
Intersection |
206 |
146 |
No-injury reported |
106 |
Involved collision |
49 |
21.1 |
*freq = frequency; docfreq = document frequency
Machine learning results
The default performance measures of the five classifiers that were considered without resampling and imbalance treatments are shown in Table 4. Among the used classifiers, Nnet had the highest prediction accuracy (90.8%) but was weak in predicting only 40% of parking-related crashes. Conversely, the Nnet classifier predicted 97.4% of non-parking-related crashes. RF and SVM had 100% specificity, meaning they could predict all non-parking-related crashes. Like Nnet, RF and SVM also predicted low parking-related crashes, 6.7%, and 0%, respectively. This study, however, intends to understand the parking-related crashes, therefore, in addition to the overall prediction accuracy, the sensitivity score is the most critical performance metric. The NB classifier has the maximum sensitivity result, but its overall prediction accuracy is lower than other classifiers. This finding calls for the need for data imbalance treatment.
|
Accuracy |
Sensitivity |
Specificity |
|
|---|---|---|---|
|
SVM |
88.5% |
0.0% |
100.0% |
|
NB |
40.8% |
73.3% |
36.5% |
|
Logitboost |
86.2% |
33.3% |
93.0% |
|
RF |
89.2% |
6.7% |
100.0% |
|
Nnet |
90.8% |
40.0% |
97.4% |
Several data imbalances and resampling treatments are available (Gao et al., 2021; Morris & Yang, 2021; Mujalli et al., 2016; Zhou et al., 2016). In this study, a total of two resampling techniques were used. These include bootstrap and cross-validation. Further, three class imbalance treatments were used, Up, Down, and SMOTE. Table 5 and Table 6 present the best resampling techniques with the three class imbalance treatments. For each case, the best-performing classifier is noted. It can be observed that Bootstrap & Up and Cross-Validation & Up are the best two resampled and class imbalance-treated classifiers using the NB model. The sensitivity score associated with Bootstrap & Up and Cross-validation & Up is 80%. For the same models, the overall accuracy was 42.3% (Bootstrap and Up) and 44.6% (Cross-validation & Up). Therefore, these two classifiers are used to infer the key features associated with parking-related crashes.
Figure 8 presents the top 20 critical features for three classifiers with high specificity, prediction accuracy, and sensitivity scores. Overall, the feature ‘reversing’ appears to be the most critical feature. The observation implies that parking-related crashes likely involve either AV or conventional vehicles reversing from the parking lot. 25 parking-related crashes involved either AV or conventional vehicle reversing.
|
Bootstrap |
||||||
|---|---|---|---|---|---|---|
|
Accuracy |
Sensitivity |
Specificity |
Accuracy |
Sensitivity |
Specificity |
|
|
Bootstarp |
Bootstrap & Down |
|||||
|
SVM |
88.5% |
0.0% |
100.0% |
68.5% |
93.3% |
65.2% |
|
NB |
40.8% |
73.3% |
36.5% |
42.3% |
66.7% |
39.1% |
|
Logitboost |
87.7% |
33.3% |
94.8% |
83.1% |
80.0% |
83.5% |
|
RF |
89.2% |
6.7% |
100.0% |
83.1% |
80.0% |
83.5% |
|
Nnet |
90.0% |
40.0% |
96.5% |
79.2% |
60.0% |
81.7% |
|
Best model |
Nnet |
NB |
SVM&RF |
Logitboost & RF |
SVM |
Logitboost & RF |
|
Bootstrap & Up |
Specificity |
|||||
|
SVM |
80.0% |
0.0% |
83.5% |
83.8% |
66.7% |
86.1% |
|
NB |
40.8% |
73.3% |
37.4% |
48.5% |
73.3% |
45.2% |
|
Logitboost |
86.9% |
13.3% |
98.3% |
87.7% |
53.3% |
92.2% |
|
RF |
89.2% |
6.7% |
96.5% |
87.7% |
33.3% |
94.8% |
|
Nnet |
90.8% |
40.0% |
93.9% |
89.2% |
46.7% |
94.8% |
|
Best model |
RF |
NB |
Logitboost |
Nnet |
NB |
RF & Nnet |
|
Cross-validation |
||||||
|---|---|---|---|---|---|---|
|
Accuracy |
Sensitivity |
Specificity |
Accuracy |
Sensitivity |
Specificity |
|
|
|
Cross-validation |
Cross-validation & Down |
||||
|
SVM |
88.5% |
0.0% |
100.0% |
60.0% |
93.3% |
55.7% |
|
NB |
40.8% |
73.3% |
36.5% |
46.2% |
73.3% |
42.6% |
|
Logitboost |
86.9% |
13.3% |
96.5% |
73.8% |
46.7% |
77.4% |
|
RF |
89.2% |
6.7% |
100.0% |
75.4% |
73.3% |
75.7% |
|
Nnet |
90.8% |
40.0% |
97.4% |
79.2% |
46.7% |
83.5% |
|
Best Model |
Nnet |
NB |
RF |
Nnet |
SVM |
Logitboost |
|
|
Cross-validation & Up |
Cross-validation & SMOTE |
||||
|
SVM |
78.5% |
66.7% |
80.0% |
83.8% |
66.7% |
86.1% |
|
NB |
44.6% |
80.0% |
40.0% |
51.5% |
73.3% |
48.7% |
|
Logitboost |
87.7% |
80.0% |
88.7% |
92.3% |
60.0% |
96.5% |
|
RF |
90.0% |
46.7% |
95.7% |
87.7% |
33.3% |
94.8% |
|
Nnet |
88.5% |
46.7% |
93.9% |
88.5% |
46.7% |
93.9% |
|
Best Model |
Nnet |
NB & Logitboost |
RF |
Logitboost |
NB |
Logitboost |
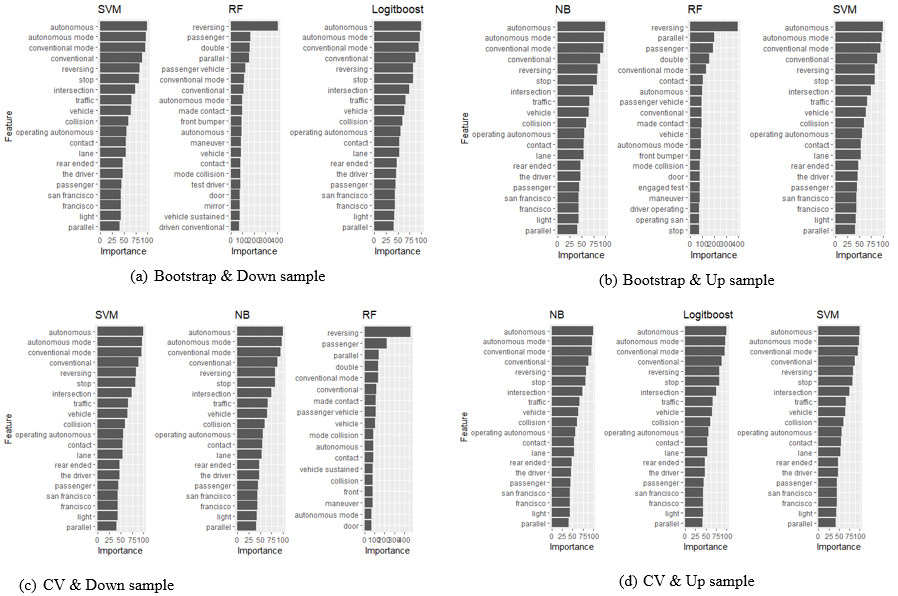
One of the typical narratives states that ‘…the Waymo AV came to a stop behind a stalled bus blocking the roadway. The driver transitioned the system to manual mode and began to reverse out of the narrow road. While reversing, a van approached from behind and the Waymo AV made contact with the front left fender of the van…’. The narrative indicates that the AV involved in the parking-related crash was in conventional mode and reversing to bypass the stalled bus.
Further, the feature ‘parallel’ appears to be ranked the highest by RF. This observation can imply that parallel parking is also associated with a high likelihood of parking-related crashes. The raw data indicates that 19 of the parking-related crashes parallel parking vehicles. For instance, one of the narratives stated that ‘…while maneuvering to avoid a parallel parking vehicle, the driver of the Cruise AV made contact with another vehicle that was pulling out of a driveway on the opposite side of the street…’. This narrative shows that AV was involved in a crash when it was performing parallel parking. Another key observation among the top 20 features is that ‘conventional mode’ is ranked higher than ‘automated’. This feature's high ranking implies that AVs were likely to be involved in parking-related crashes when manually operated. However, the feature ‘automated’ in the top 20 most essential features suggests that several crashes involved AVs in autonomous mode. Other features such as front passenger, mirror, front bumper, injury, etc. explain more of what happens after a collision than what causes a collision.
Conclusions
This study investigated factors associated with parking-related crashes involving AVs. A total of 460 AVs crashes collected by the CDMV within six years (2017–2022) were analysed. Text network analysis was applied to identify factors associated with parking- and non-parking-related crashes in unstructured narrative data. Using text network topology, keyword frequency, co-occurrence, and collocations, features peculiar to parking- and non-parking-related crashes could be identified. For example, AVs operated more in a conventional mode in parking spaces than in non-parking spaces. In addition, it was identified that AVs are likely to collide with non-motorized vehicles in non-parking areas as compared to parking spaces. However, rear-end collisions were found to be shared in both parking and non-parking areas.
Furthermore, the study used five text classifiers—SVM, NB, Logitboost, RF, and Nnet—to predict parking-related crashes. Performance metrics like accuracy, sensitivity, and specificity were used to compare the classifiers. In addition, two resampling techniques–bootstrap and cross-validation were employed to account for data imbalances and resampling treatments. Results from classifiers indicated that parking-related crashes are likely to involve either AV or conventional vehicles reversing from the parking lot. In addition, parallel parking was associated with a high likelihood of parking-related crashes.
Based on the study results, AV operators need to improve AV operation during parking especially when reversing in the parallel parking. The narratives indicated that reverse was among the keywords that appear more frequently and associated with parking-related crashes. Furthermore, the additional considerations should be given to the parking procedures. The fact that most of AVs are in conventional mode during parking shows that AVs are not performing well in that aspect. This can be solved by having dedicated sensor for parking maneuvers, which will be calibrated using parking environment to improve its accuracy and reduce parking-related crashes.
Study limitations
This study has some limitations which need to be addressed in future research. Firstly, while traditional crash data are collected by the police, this study used crash data reported by vehicle owners. That being the case, the accuracy of the data is not guaranteed, thus, future research might obtain police crash reports and compare crash narratives. This study used data from California, however, currently various states are testing AVs and are collecting crash data. Future studies may consider crash data from all states testing AVs. Lastly, text classifications work better with large data. The sample size of 460 crashes is relatively small, and the results obtained need to be carefully interpreted. Future studies can use large sample sizes for broader analysis.
Declaration of competing interests
Authors have no competing interest of any kind.
CRediT contribution statement
Boniphace Kutela: Conceptualization, Methodology, Data curation, Investigation, Writing—original draft.
Ricard Dzinyela: Conceptualization, Methodology, Data curation, Investigation, Writing—original draft.
Henrick Haule: Data curation, Investigation, Writing—original draft.
Abbas Sheykhfard: Writing—original draft.
Kelvin Msechu: Data curation, Investigation, Writing—original draft.