Bicycling during alcohol intoxication
Handling editor: Mette Møller, Technical University of Denmark, Denmark
Reviewers: Wouter Van den Berghe, Tilkon Research & Consulting, Belgium
Anonymous Reviewer, not disclosed due to disagreement with editor's decision
Received: 2 January 2023; Accepted: 11 May 2023; Published: 22 May 2023
Abstract
The number of bicycling fatalities was 19 450 between 2010 and 2018 in Europe. The number of bicyclists killed when intoxicated by alcohol is harder to establish given the lack of reliable data. In Sweden, drunk bicycling is socially acceptable and legal (unless reckless). This experiment aimed to investigate how alcohol intoxication affect bicycling stability performance, executive functions, and self-rated ability. The experiment was completed on a wide treadmill that allowed control of several influencing factors such as speed and physical effort. Intoxicated and sober participants bicycled on the treadmill for five 10 minute sessions. Alcohol as administered incrementally to reach a target breath alcohol concentration level of 0.8‰. Stability decreased with intoxication; especially roll rate measurements were identified as being adequate indicators of bicycling instability. Executive function was negatively affected, and ability ratings decreased due to intoxication. The intoxicated participants were aware of their reduced ability to bicycle in a safe manner on a group level but not on an individual level. However, this insight does not affect their intention to bicycle intoxicated.
Keywords
alcohol intoxication, bicycling performance, cognition, stability
Introduction
Bicycling accidents is the most common traffic accident type in Sweden (Rizzi et al., 2020), with over 23 000 bicyclists seeking care at accident and emergency hospitals every year (MSB, 2013). In Europe, the number of bicycling fatalities was 19 450 between 2010 and 2018 (Adminaité-Fodor & Jost, 2020). How many of these fatalities that are caused by the bicyclist being intoxicated by alcohol is not known, but estimates range from 5% to 18% (Adminaité-Fodor & Jost, 2020). The risk of involvement in a non-fatal bicycling crash is also much higher when intoxicated by alcohol (Asbridge et al., 2014), and alcohol intoxication is also associated with more severe injuries, increased hospital resources and a higher mortality rate (Sethi et al., 2016). Intoxicated bicyclists more often fall from their bikes and are less often injured from collisions with motor vehicles.
de Waard et al. (2016) showed that bicyclists under the influence of alcohol were highly involved in accidents (range, 15–57%). They also found that the prevalence of intoxicated bicyclists was more common during night, increasing from 7.7% at 6 PM to 89% after 1 AM in a student town. In a forensic autopsy study by (Takeda et al., 2020), alcohol was found in the blood of 52% of the 14 investigated bicyclists. The mean blood alcohol concentration of these bicyclists was 1.59 mg/mL. Airaksinen et al. (2018) showed that males were more often injured when intoxicated, and head injuries were more common among the intoxicated. The percentage of fatally injured bicyclists with high levels of alcohol declined from 28% to 21% (from 1982 to 2014) in the United States, which is a much lower decline rate compared to fatally injured passenger vehicle drivers in the same time period (Eichelberger et al., 2018). In many European countries, the blood alcohol content (BAC) limit is set at 0.5 g/l, or there is no specific limit for bicycling (Adminaité-Fodor & Jost, 2020). In Sweden, it is socially acceptable and legal (unless reckless) to ride a bicycle under the influence of alcohol (Wallén_Warner et al., 2017), and there is no set BAC limit.
The fitness to ride a bicycle is impaired already at low BAC levels, with great individual variation both between genders and within gender (Hartung et al., 2015). The extent that bicycling stability is affected by different intoxication levels, and how this relates to cognitive performance and rated bicycling ability, is yet not well understood.
Bicycling stability
One aspect to consider when investigating bicycling performance during alcohol intoxication is how the bicycle is handled by the bicyclist, i.e. the stability of the individual when bicycling. The literature on bicycling stability (balance) reveals that speed is important (Cain et al., 2016). At lower speeds, novice and skilled bicyclists show similar balance performances, but at higher speeds, skilled bicyclists use more lean control and less steer control. (Hartung et al., 2015) studied bicycling performance and found severe coordinative faults when participants bicycled under the influence of alcohol. In addition, they found differences between men and women in terms of the BAC level at which severe faults occurred.
Executive functions
The literature suggests that there is a complex interplay between alcohol intoxication and cognitive performance (Adminaité-Fodor & Jost, 2020; Cash et al., 2015; Greenstein et al., 2010; Mintzer, 2007; Park et al., 2011; Weiss & Marksteiner, 2007). The results suggest that cognitive functions are usually affected by alcohol intoxication, but not always (Hoffman et al., 2015; Spinola et al., 2017). Several cognitive tests have been administered, and differences have been found between age groups (Boissoneault et al., 2014), gender (Hoffman et al., 2015) and even naturalistic settings (Lyvers & Tobias-Webb, 2010). Individuals take riskier decisions when intoxicated (George et al., 2005), and it has been argued that self-regulation impacts cognitive executive function, such that alcohol intoxication might affect risk taking (Brooks et al., 2019).
Self-assessment of ability and intention to bicycle under alcohol intoxication
The present experiment focused on ability, even though reduced ability almost certainly increases risk. It is predicted that the results for gambling tasks, such as that used by George et al. (2005), would be true for bicycling on a treadmill as well. However, the present study focused on the ascending curve of BAC levels (up to the peak of 0.8‰ breath alcohol content, BrAC), and it was difficult to predict when a reduction in ability ratings would present itself. Hartung et al. (2015) found deficits at relatively low BAC levels. In addition, as the Feenstra et al. (2010) study revealed, positive attitudes towards alcohol might be related to the ability ratings made by participants.
A Swedish questionnaire study with 1 769 participants, aged 18–65 years, revealed that approximately 50% of the participants had bicycled when intoxicated with alcohol at least once during January to August 2018 (Wallén_Warner et al., 2018); see also (Huemer, 2018). Intention, defined as the willingness to try to perform the behaviour, was therefore included in the study.
Aims and objectives
The experiment focused on stability measurements and their relation to alcohol intoxication levels. The primary aim of this study was to investigate how bicycling stability decreased as an effect of higher intoxication levels. A secondary aim was to investigate if and how cognitive performance and ability ratings was related to different levels of intoxication and stability.
The experiment was conducted in a controlled setting on a large treadmill, enabling control of speed and physical effort. To relate the treadmill results with reality to some extent, bicycling on the treadmill was combined with self-reports of the participants’ intentions to bicycle in real traffic when intoxicated with alcohol. It was predicted that participants would have a strong intention to bicycle in real traffic, despite being so intoxicated that their stability, executive functions, and bicycling abilities were affected.
Methods
Participants
A total of 29 participants were enrolled in the study, see Table 1 for details. Of these 29 participants, 18 were given alcohol during the experiment (intoxicated group), while 11 participants completed the bicycling test sober (sober control group). Participants were randomised after screening. The objective was to minimise age difference and balance for gender.
|
Parameter |
Intoxicated group |
Sober control group |
|---|---|---|
|
Total participants, n |
18 |
11 |
|
Females, n |
9 |
6 |
|
Age, years |
25–32 (average = 28) |
22–32 (average = 25) |
|
Weight (average), kg |
79 |
78 |
|
AUDIT (rating 1–9) |
5.67 (SD = 2.40) |
5.91 (SD = 3.73) |
The first column shows data for the intoxicated group, who were given increasing amounts of alcohol while bicycling; the second column shows data for the sober control group, who bicycled sober.
The participants were recruited via a Facebook advertisement and by personal contacts. Prospective participants were directed to a dedicated project webpage, where the required criteria for participation (age gender, health etc.) were checked as the first step for inclusion in the study. The participant screening criteria included: a minimum age of 20 years old, no history of alcohol or substance addiction, and good health for bicycling. The participant criteria also included living within the town of Falun (to limit taxi costs after the end of the experiment). Only non-pregnant women could participate in the experiment and women were offered a pregnancy test upon request. Other requirements included previous experience of bicycling and drinking alcohol.
The selection of participants included several steps, starting with the initial screening mentioned above. The screening procedure was repeated when each participant arrived at the test facility. The Alcohol Use Disorders Identification Test (AUDIT) (Saunders et al., 1993) scale was also completed and checked prior to the experiment. The participants needed to be able to stay on the facilities for approximately 4 hours, so that their post-experiment safety and sobriety could be monitored.
The participants were reimbursed for their participation with approximately €150 or €75 (the sober control group did not have to wait at the facility until their BrAC level was low). All participants were also offered a cost-free taxi ride home. The study was approved by the Swedish Ethical Review Authority (approval number 2019-01268).
Materials
The experiment was carried out in the sports laboratory at Lugnet's Sports Science Institute, in co-operation with Dala Sports Academy, in Falun, during July, October/November 2019 and May 2022. The complete set-up and context were the same during all three periods. The participants bicycled on a motor-driven treadmill (Saturn 450/300 RS; H/P/Cosmos Sports & Medical, Nussdorf, Germany), which had a surface area of 13.5 m2 and could be tilted to increase physical workload (if necessary). The treadmill’s general specifications comprised a running surface of 4.5 × 3.0 m, a speed range of 0–40 km/h, an elevation of -5% to +25% (-2.8 to 14.0 degrees), a 30 kW motor system (40.8 HP), and a re-enforced thick rubber running belt that is also suitable for use with ski rollers, ski poles, track shoes and bicycles.
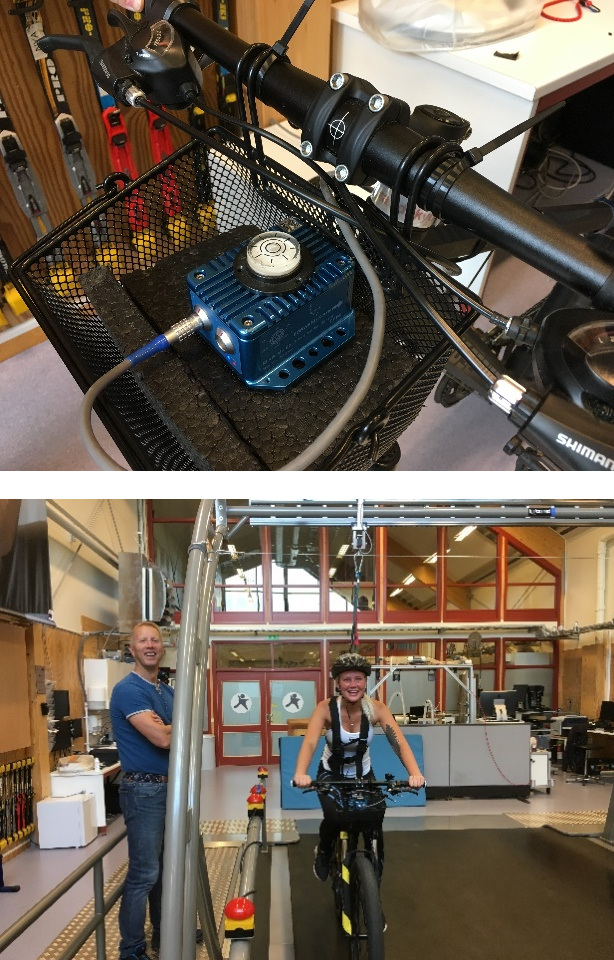
The participants bicycled on a mid-range mountain bike (Biltema Yosemite X-dirt bicycle), with relatively large wheel dimensions for stability (27.5 × 2.8 inch wheels). The brakes were disconnected on the test bicycle. The bicycle was equipped with a VBOX data acquisition system mounted on the handlebar (Racelogic 3i, Buckingham, UK) and gyro sensor (Racelogic IMU02, Buckingham, UK), see Figure 1. The participants wore a pulse sensor (to monitor their physical effort) that was connected to the treadmill system. The participants also wore a safety harness, which was attached to the gantry above the treadmill. The harness attachment point was connected to a kill-switch, to enhance safety. All participants wore a bicycle helmet.
Design
This experiment used a mixed design. The between group variable was intoxicated versus sober, to investigate the effects of alcohol intoxication on participants’ bicycling performance. The second independent variable was the breath alcohol concentration (BrAC) level, measured 5 times. The dependent variables were stability (yaw and roll rate), cognitive performance (n-back score), subjective level of intoxication (CR10 rating) and ability assessment (rating). Speed and physical exertion might affect the results as well; the experimental set-up controlled for these aspects by keeping the speed at 20 km/h and physical exertion constant by adjusting the gradient of the treadmill between 0.2 and 2.0 degrees (mean = 0.9 degrees; SD = 0.47) to maintain a uniform level of physical workload.
Procedure
The 29 participants were first given study information and instructions, and then signed an informed consent form. A health declaration was also completed by the participants. In addition, the participants were asked about any food allergies, as snacks were provided. All participants were measured and screened upon arrival (weight, identity check, 0‰ BrAC level and pregnancy). The participants also filled in a pre-test questionnaire, covering questions about their age and gender, as well as their bicycling, physical activity and drinking habits.
The bicycling test consisted of five sessions (time 1–time 5). Each session comprised: (1) a 10-minute bike ride on the treadmill, (2) a mouth wash to reduce possible effects of alcohol still left in the mouth, (3) a BrAC assessment, (4) a subjective intoxication rating, (5) the 20 item Borg Scale of Perceived Exertion rating, (6) an n-back task, (7) a subjective ability rating, and (8), time for refreshments, drinking alcohol, and rest. In the bicycling part, the experiment leader stabilised the participant by holding the gantry until the target speed was reached. The same procedure was used before the treadmill was stopped.
The alcohol dosage was calculated according to Mumenthaler et al. (1999) based on the participant’s gender and weight (the mean quantity of 40% spirits administered was 197 ml (SD = 55.2 ml); range = 140–340 ml). The participants in the intoxicated group could choose between whisky, white rum, vodka, or gin. The spirits could be mixed with soft drinks to make them more palatable. After the first sober 10-minute bicycle ride (time 1), participants in the intoxicated group were given 75% of the estimated alcohol dosage calculated to reach the target of BrAC = 0.8‰. The remaining 25% were given after the second 10-minute bicycle ride (time 2). Since the algorithm typically underestimated the alcohol dosage, a third drink was administered in later sessions if the target level of BrAC = 0.08‰ had not been reached. Participants were never told about their level of intoxication.
When the participants had completed the five bicycling sessions on the treadmill, they completed the post-test questionnaire. The participants then remained in the research laboratory facility until they became sober (several hours later) after which they were offered a taxi home. The ‘sober’ level was negotiated to some extent, not all participants’ BrAC levels were below 0.2‰ when they left the laboratory. The sober control group were free to leave as soon as all post-test evaluations were completed.
Measures
BrAC levels. Participants BrAC level was computed as the mean value of 4 repeated measurements with 2 different breathalysers (Models 6 810 and 6 820, Drägerwerk AG & Co, Lübeck, Germany) after each bicycling session. Both breathalysers were calibrated and comply with the standards required by the Swedish police (EU Police approval code: EN15 964). The literature reveals that the Dräger 6 810 is reliable, and no significant differences exist between BrAC and BAC if the instruments are used according to the manufacturer’s instructions (Jurič et al., 2018).
Subjective rating of intoxication. The subjective level of intoxication was determined via ratings based on the Borg CR10 scale used for measuring perceptions and experiences (Borg, 1982). The questions were presented together with information that reminded the participant of the scale to be used. The purpose was to investigate the degree to which subjective levels of intoxication were related to BrAC values. Answers were rated on a 10 point scale, where 0 = no intoxication, 0.5 = very weak intoxication, 1 = weak intoxication, 3 = moderate intoxication, 5 = strong intoxication, 7 = very strong intoxication and 10 = extremely strong intoxication (maximum).
Stability. Stability was estimated as the variability in the of yaw rate and roll rate measurements. Variability was here defined in two different ways: as the standard deviation (SD) and as the reversal rate (RR) of yaw rate and roll rate, respectively. All stability measures were calculated from the mid 8-minute segment of the 10 minute bicycling sessions on the treadmill. The first and last minutes were removed to exclude data where the experiment leader gave stability support.
The yaw and roll RR metrics were inspired by the steering wheel reversal rate (SWRR) that has been used in car driving as an indicator of distraction (Wang et al., 2019), visual deficits (Bronstad et al., 2016) and drowsiness (Xu et al., 2016). SWRR has also been shown to be affected by alcohol intoxication in curve taking (Li et al., 2019), where increased intoxication led to increased instability. SWRR is defined as the number of steering wheel reversals larger than a certain gap size (Macdonald & Hoffman, 1980). How large this gap size should be when applied to yaw and roll rate reversals is not known. A range of values from 5 to 25 degrees/second were therefore evaluated in this study.
N-back task. Over approximately 1 minute, 26 letters were presented one by one in a random order in 2.0 second intervals on a screen (Gevins & Cutillo, 1993). The participants' task was to respond ‘Yes’ if the letter presented on the screen was also presented two letters before. For the first two letters, the participants did not have to answer anything as there were no two previous letters to compare with. Letters and Yes/No items were randomised. However, when a letter was presented, the participant could answer Yes and be correct, or No and be correct as well. For example, when the letter A was presented and the target was A, it was a hit if the participant answered Yes or a miss if the participant responded No. When A was presented and the target was B, it was a correct rejection if the participant answered No, but a false alarm if the participant responded Yes. Hence, four possible measures can theoretically be obtained, allowing sensitivity measurements such as d-prime. There were 8 possible hits and 18 correct rejections.
Subjective rating of ability. The subjective level of ability was measured with four questions: ‘Would you be able to move 50 cm to the left with the bike and back again if you wanted to?’, ’Would you be able to stand up and bicycle if you wanted to?’, ‘Would you be able to bicycle with only one hand on the handlebars if you wanted to?’ and ‘Would you be able to bicycle slalom if you wanted to?’ The possible responses were: 1 = no problems, 2 = with small problems, 3 = maybe, 4 = with big problems and 5 = absolutely not. The questions were developed during pilot testing. Cronbach's alpha varied between 0.92 and 0.85 for the four ratings at each time of assessment.
Intention. Intention was measured by one item for the highest level of intoxication that the participants experienced during the test, and one item for a higher, hypothetical, level of intoxication than the participants experienced during the test: ‘I intend to bicycle when I feel/feel more intoxicated than [XX] over the next 3 months: likely/not at all likely’, where ‘XX’ was replaced by the highest level of intoxication that the participants reported during the bicycling test. Response scale 1 = likely; 7 = not at all likely.
Borg Scale of Perceived Exertion. The 20 item Borg Scale of Perceived Exertion rating (Borg, 1970) was used to attain a standardised measurement of physical effort for all participants. When effort was rated high (a rating of 13 or higher), the gradient of the treadmill was adjusted accordingly.
Statistical considerations
The data were analysed with several separate variance analyses. Multiple testing’s (Bonferroni correction) and sphericity was always accounted for. An alpha level of 0.5 was used. Pairwise comparisons were used to get a better understanding of significant effects.
Results
Overall findings
All participants answered/completed several questions/tests before, during and after each 10 minute bicycle ride. A summary of these results is provided in Table 2.
|
Parameter |
Intoxicated group |
Sober group |
|---|---|---|
|
Alcohol measured (‰)* |
|
|
|
BrAC at test 1 |
0 |
0 |
|
BrAC at test 2 |
0.31 (0.09) |
0 |
|
BrAC at test 3 |
0.59 (0.10) |
0 |
|
BrAC at test 4 |
0.73 (0.10) |
0 |
|
BrAC at test 5 |
0.75 (0.08) |
0 |
|
Subjective rating of BrAC (‰)** |
|
|
|
Rating at test 1 |
0 |
0 |
|
Rating at test 2 |
0.67 (0.51) |
0 |
|
Rating at test 3 |
1.60 (0.99) |
0 |
|
Rating at test 4 |
2.26 (0.98) |
0 |
|
Rating at test 5 |
2.40 (1.31) |
0 |
|
N-back score |
|
|
|
d-prime at test 1 |
2.78 (1.32) |
2.71 (1.92) |
|
d-prime at test 2 |
3.39 (1.66) |
3.28 (1.57) |
|
d-prime at test 3 |
3.46 (1.68) |
3.90 (1.66) |
|
d-prime at test 4 |
3.04 (1.63) |
4.30 (1.33) |
|
d-prime at test 5 |
3.50 (1.36) |
4.66 (1.35) |
|
Subjective rating of ability |
|
|
|
Rating at test 1 |
6.64 (3.04) |
8.18 (4.71) |
|
Rating at test 2 |
6.78 (2.92) |
6.27 (3.00) |
|
Rating at test 3 |
8.31 (4.03) |
5.73 (2.45) |
|
Rating at test 4 |
8.96 (4.03) |
5.64 (2.29) |
|
Rating at test 5 |
9.11 (3.74) |
4.45 (2.73) |
|
Pre-test question |
|
|
|
How often did you drink alcohol during 2018? (per month) |
2.83 (0.51) |
2.63 (0.92) |
|
How often did you bicycle during the snow-free period of 2018? (per week) |
3.94 (1.11) |
2.45 (1.39) |
|
How often did you work-out during 2018? (per week) |
4.16 (0.92) |
3.82 (0.98) |
|
How often did you bicycle while intoxicated during the snow-free period of 2018? |
1.89 (0.58) |
1.18 (0.40 |
*Alcohol consumption level was 19.7 cl for the intoxicated group and 0 cl for the sober group.
**0.5 = very weak intoxication; 1 = weak intoxication; 3 = moderate intoxication.
SD = standard deviation; BrAC = breath alcohol concentration
The pre-test questionnaire results revealed that both groups drank alcohol approximately two to four times a month (mean of 2.83 and 2.63 times per month respectively) and worked out two to three times a week (mean of 4.16 and 3.82 times per week respectively). Intoxicated participants bicycled significantly more often (mean of 3.94 and 2.45 times per week respectively) and bicycled significantly more often when intoxicated during the snow-free period of 2018 (mean of 1.89 and 1.18 times a month respectively). Hence, the intoxicated group might have been somewhat more familiar with bicycling and bicycling while intoxicated. These differences between the groups will probably not affect the results given the design used, i.e., the between-groups design where two groups bicycled while experiencing different levels of intoxication.
A 2 (group) by 5 (test times) analysis of variance (ANOVA) showed that subjective exertion ratings (measured via the Borg Scale of Perceived Exertion) were unaffected over time or between groups (mean for the intoxicated group = 11.67 and mean for the sober control group = 12.04). Hence, the adjustment of the tread mills gradient was successful, meaning that the other measurements (stability, executive function, and ability rating) should be unaffected by different degrees of experienced physical effort. Overall, the results indicate that the two groups were comparable in all aspects studied.
Gender differences
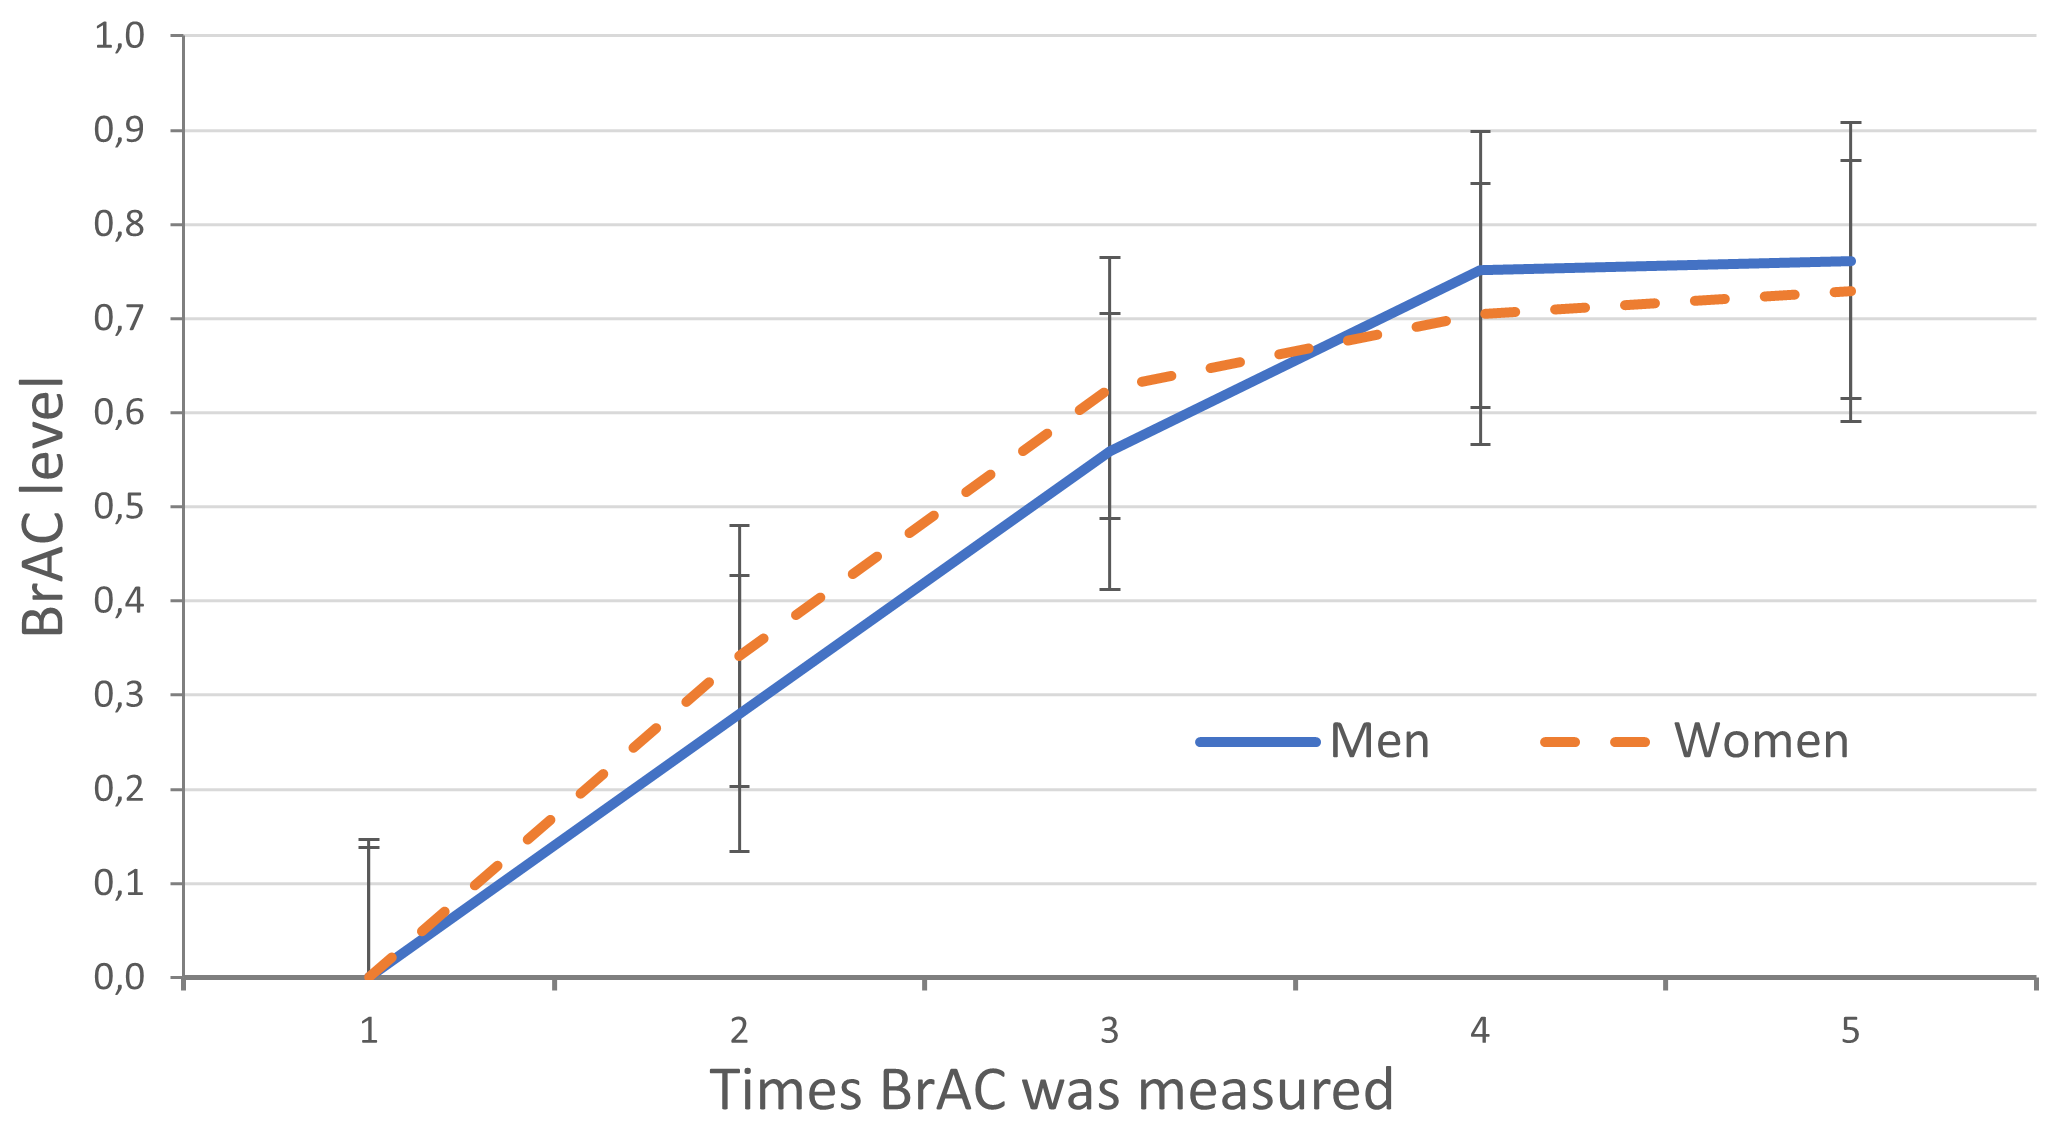
The results revealed that women’s and men’s BrAC levels were very similar over the sessions. The 2 (women versus men) by 5 (number of times BrAC levels were measured) ANOVA revealed one significant effect (only intoxicated participants were compared), namely that the BrAC level increased over time (F(1, 16) = 341, p < 0.001, Mse = 0.05). This was expected given the experimental design. In subsequent analyses, we therefore examined the intoxicated group as a whole, without included gender as a factor. Figure 2 reveals a constant rise in BrAC level until assessment time 4, where intoxicated participants started to reach their peak.
Stability
Mean values and SDs for all variability measures are presented in Table 3. The roll rate measures for the last 7 sober control participants were affected by unknown technical problems. Roll rate measures were therefore only calculated for 4 sober control participants.
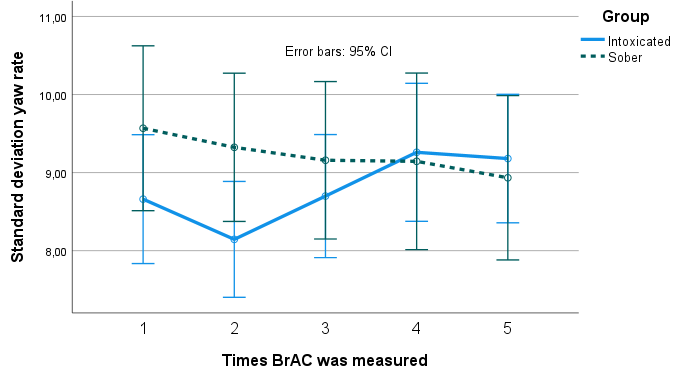
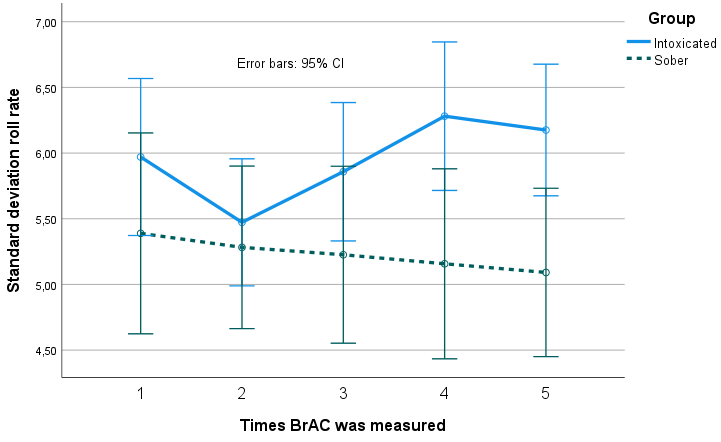
A 2 (group) by 5 (times) mixed ANOVA on the SD of yaw rate and SD of roll rate revealed no main effects; however, there was a significant interaction effect for both measures. Figure 3 and Figure 4 show that the intoxicated group became increasingly unstable, while the sober group became marginally more stable over time.
Pairwise comparisons of yaw rate SD revealed that intoxicated participants' stability increased from time 1 to time 2 (not significantly, p = 0.076), but later decreased from time 2 and onwards (except between time 4 and time 5). The mean increase in yaw rate SD from time 2 to time 3 was 0.554 (p > 0.001), and 0.561 from time 3 to time 4 (p > 0.001).
Pairwise comparisons of roll rate SD revealed that intoxicated participants' stability increased from time 1 to time 2, (mean increase 0.498, p < 0.02) but later decreased from time 2 and onwards (except between time 4 and time 5). The mean increase in roll rate SD from time 2 to time 3 was 0.385 (p > 0.001), and 0.423 from time 3 to time 4 (p > 0.001).
|
Group |
Test |
Roll rate |
Yaw rate |
||||||||||
|---|---|---|---|---|---|---|---|---|---|---|---|---|---|
|
SD |
5°/s |
10°/s |
15°/s |
20°/s |
25°/s |
SD |
5°/s |
10°/s |
15°/s |
20°/s |
25°/s |
||
|
Intoxicated |
1 |
5.9 (1.1) |
751 (102) |
409 (118) |
175 (89) |
62 (45) |
22 (19) |
8.7 (1.6) |
889 (108) |
567 (139) |
298 (116) |
133 (73) |
54 (40) |
|
2 |
5.5 (1.0) |
708 (116) |
364 (117) |
139 (76) |
43 (37) |
13 (17) |
8.1 (1.6) |
863 (137) |
518 (148) |
255 (124) |
104 (84) |
40 (51) |
|
|
3 |
5.9 (1.1) |
734 (107) |
415 (113) |
180(88) |
67 (53) |
25 (28) |
8.7 (1.7) |
892 (129) |
575 (141) |
312 (124) |
148 (97) |
65 (64) |
|
|
4 |
6.3 (1.3) |
750 (98) |
458 (122) |
236 (104) |
104 (73) |
43 (41) |
9.3 (2.0) |
899 (126) |
614 (146) |
376 (139) |
200 (111) |
96 (80) |
|
|
5 |
6.2 (1.1) |
741 (97) |
452 (110) |
230 (94) |
97 (66) |
40 (40) |
9.2 (1.8) |
896 (122) |
612 (139) |
369 (129) |
196 (104) |
93 (77) |
|
|
Sober |
1 |
5.4 (1.0) |
808 (32) |
491 (107) |
242 (122) |
103 (78) |
40 (34) |
9.6 (1.9) |
946 (89) |
625 (147) |
356 (137) |
166 (106) |
76 (65) |
|
2 |
5.3 (1.0) |
795 (15) |
440 (71) |
183 (73) |
56 (38) |
18 (16) |
9.3 (1.4) |
948 (63) |
616 (90) |
327 (99) |
146 (76) |
57 (42) |
|
|
3 |
5.2 (1.1) |
778 (57) |
425 (113) |
168 (93) |
61 (54) |
22 (23) |
9.2 (1.4) |
929 (69) |
596 (124) |
309 (113) |
138 (78) |
55 (40) |
|
|
4 |
5.2 (1.0) |
776 (91) |
422 (123) |
170 (80) |
46 (28) |
10 (7) |
9.1 (1.5) |
932 (76) |
607 (115) |
326 (125) |
149 (87) |
58 (47) |
|
|
5 |
5.1 (0.8) |
745 (61) |
378 (80) |
134 (60) |
37 (24) |
11 (8) |
8.9 (1.5) |
916 (84) |
570 (141) |
298 (119) |
133 (71) |
51 (37) |
|
Data represent: Mean (SD)
|
Group |
Time |
Group x Time |
||
|---|---|---|---|---|
|
Roll rate RR |
5°/s |
ns |
ns |
ns |
|
10°/s |
ns |
ns |
F (4, 80) = 5.62, p < 0.001, MSe = 2723 |
|
|
15°/s |
ns |
ns |
F (4, 80) = 7.02, p < 0.001, MSe = 2232 |
|
|
20°/s |
ns |
ns |
F (4, 80) = 7.00, p < 0.001, MSe = 920 |
|
|
25°/s |
ns |
ns |
F (4, 80) = 5.08, p < 0.001, MSe = 307 |
|
|
SD |
ns |
ns |
F(4, 108) = 4.16, p < 0.005, MSe = 0.25 |
|
|
Yaw rate RR |
5°/s |
ns |
ns |
F(4, 108) = 2.98, p < 0.03, MSe = 1444 |
|
10°/s |
ns |
ns |
F(4, 108) = 6.64, p < 0.001, MSe = 3069 |
|
|
15°/s |
ns |
F(4, 108) = 4.58, p < 0.01, MSe = 3092 |
F(4, 108) = 8.84, p < 0.001, MSe = 3092 |
|
|
20°/s |
ns |
F(4, 108) = 5.48, p < 0.001, MSe = 1843 |
F(4, 108) = 8.34, p < 0.001, MSe = 1843 |
|
|
25°/s |
ns |
F(4, 108) = 3.83, p < 0.01, MSe = 888 |
F(4, 108) = 6.94, p < 0.001, MSe = 888 |
|
|
SD |
ns |
ns |
F(4, 108) = 4.72, p < 0.01, Mse = 0.56 |
|
|
N-Back (d-prime) |
ns |
F(4, 108) = 3.51, p < 0.01, MSe = 1.93 |
ns |
|
|
Ability rating |
ns |
ns |
F(4, 108) = 14.51, p < 0.001, Mse = 2.81 |
|
ns = non-significant
A total of 10 analyses were performed for the yaw rate and roll rate RR measures, i.e. 2 for each of the five gap sizes (Table 3). The RR measures revealed a clear pattern. First, the 2 (group) by 5 (times) mixed ANOVA on yaw rate RR as well as on roll rate RR with 5 and 10°/s gap sizes revealed no main effects but interaction effects for 3 of the 4 analyses (see Table 4). Hence, these four analyses revealed that intoxication did not have the same effect on small gap sizes.
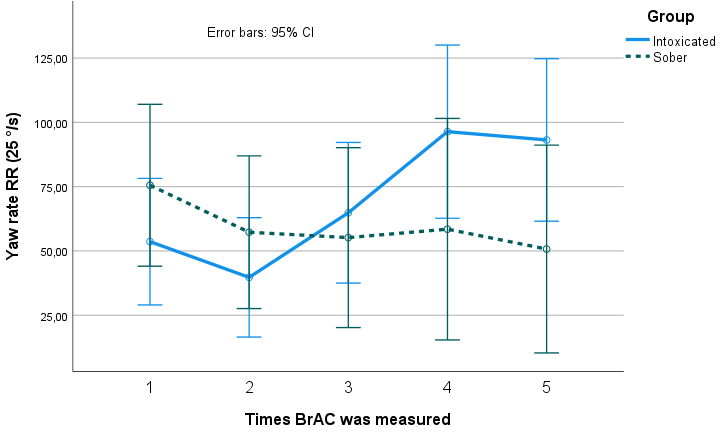
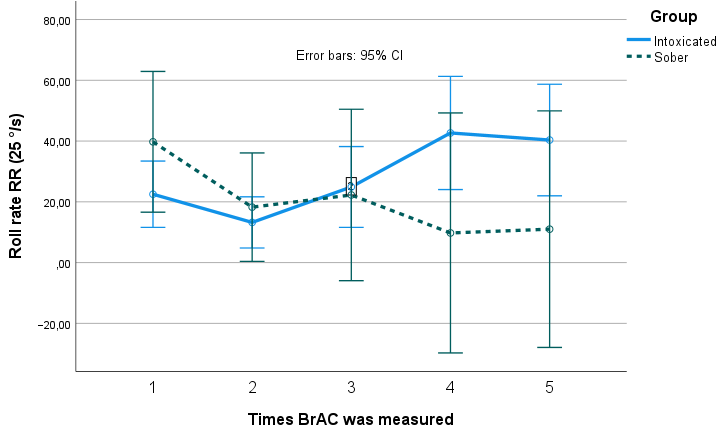
Second, the 2 (group) by 5 (times) mixed ANOVA on yaw rate RR at 15°/s, 20°/s and 25°/s gap sizes revealed interaction effects and main effects of time (see Figure 5 as an example). The 2 (group) by 5 (times) mixed ANOVA on roll rate RR at 15°/s, 20°/s and 25°/s gap sizes revealed interaction effects as presented in Figure 6 (as an example). Pairwise comparisons are presented only for the 25°/s gap size roll rate RR and yaw rate RR analyses. Similar patterns were observed for all three yaw and all roll rate analyses at 15°/s, 20°/s and 25°/s gap sizes, respectively. The sober group became marginally more stable over time.
Just as for the yaw and roll rate SD measures, pairwise comparisons of the yaw and roll rate RR measures revealed that intoxicated participants became significantly more unstable over time (from time 2 and onwards, except between time 4 and 5). The mean increase in yaw rate RR with 25°/s gap size from time 2 to time 3 was 25.11 (p < 0.001), and 31.56 (p < 0.001) from time 3 to time 4. Corresponding increases for roll rate were 11.67 (p < 0.02) from time 2 to time 3, and 17.78 (p < 0.04) from time 3 to time 4, respectively.
Executive functions
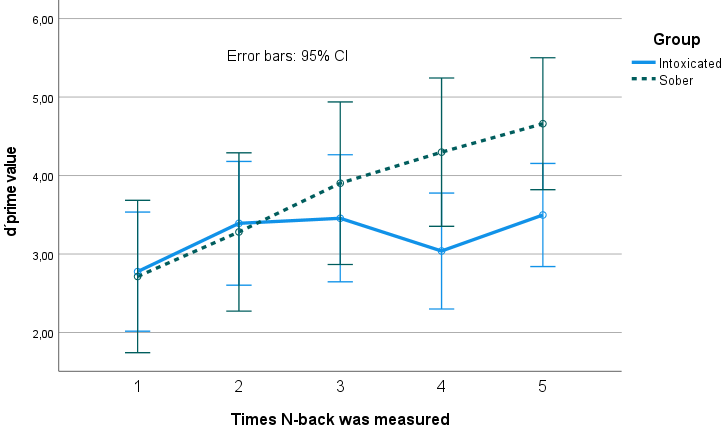
The n-back test results were analysed in terms of d-prime values based on the relation between hits and false alarms (see Macmillan and Creelman (1991) for details). The 2 (group) by 5 (times) mixed ANOVA revealed a main effect of time (see Table 4). No significant effects were found for group or for the interaction between group and time. Pairwise comparisons revealed no significant effects at times 1, 2 and 3 but significant differences between the sober group and the intoxicated group at time 4 (mean diff = 1.26, p < 0.04) and 5 (mean diff = 1.16, p < 0.04), see Figure 7). Hits, false alarms, correct rejections, and misses were also analysed, and the findings point in the same direction as the d-prime analysis but to a lesser extent.
Ability assessment
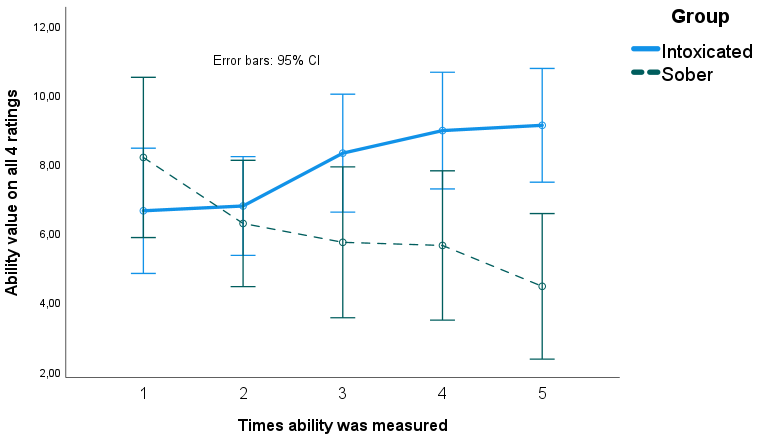
The 2 (group) by 5 (times) mixed ANOVA showed a significant interaction between group and time. Pairwise comparisons revealed that the sober group rated themselves as more able over time whereas the intoxicated group rated themselves as less capable. Significant differences were found between the groups at time 4 (mean diff = 3.32, p < 0.02) and at time 5 (mean diff = 4.46, p < 0.001). Figure 8 suggests that the intoxicated group showed an understanding of their condition, i.e. lower abilities when intoxicated.
Correlation analysis
Correlation analyses were carried out for the intoxicated participants (since all sober participants had an intoxication level of BrAC 0.00‰). In total 12 analyses where made, namely the correlation between BrAC and the subjective rating of intoxication, between BrAC and the ability ratings, and between the subjective intoxication ratings and the ability ratings, for each of the four assessment times of interest (times 2–5, at time 1 all participants were sober). None of the correlation results were significant. First, the participants could not predict their level of intoxication. Second, the correlation between how intoxicated they were or how intoxicated they experienced that they were nor correlated with the decrease in ability rating. The insignificant results, together with the ability rating results on a group level in the previous section, indicate that the intoxicated group rated, as a group, that their bicycling ability decreased due to alcohol intoxication, but this was not true on an individual level based on the correlation analysis.
Intention to bicycle when intoxicated with alcohol
Only data from the 15 participants in the experiment group during July were included in these analyses as intention were measured with regard to the upcoming three months, and it was likely to snow in the three months following the October/November experimental session. The 15 participants were aged 25–32 years (average of 29 years), and 6 were women. Most participants experienced moderate levels of alcohol intoxication during the tests, according to the modified CR10 scale (mean score = 2.64, range = 0.50–5.00).
The results showed that the participants' intention to bicycle in real traffic at the highest level of intoxication they experienced during the test was fairly neutral (M = 3.93, SD = 2.49; where 1 = likely; 7 = not at all likely) while their intention to bicycle at an even higher, hypothetical, level of intoxication was lower (M = 5.20, SD = 2.11; where 1 = likely; 7 = not at all likely). A Wilcoxon signed-ranks test indicated that the difference in intention was significant (Z = -2.39, p < 0.05).
Discussion
The first comparison of the experiment revealed that the intoxicated and sober groups were comparable in terms of alcohol consumption habits and how often they worked out, but the participants in the intoxicated group bicycled more often than the participants in the sober group. The manipulation of alcohol doses at different time points was successful, and women and men were both intoxicated to the same extent at the different time points. The number of participants in the sober control group was small for several practical reasons. Notwithstanding, the results revealed a clear pattern.
The analyses of instability revealed three important results. Firstly, alcohol intoxication led to decreased stability, starting already at low intoxication levels. The results are confounded with a learning effect of bicycling on the treadmill, where stability increased for all participants between test 1 and test 2, when all participants were quite sober. It is therefore difficult to determine the exact time point when instability due to alcohol intoxication was evident, but it was sooner than expected (see also (Hartung et al., 2015)). Secondly, the instability measurements were less affected when small gap sizes were used. Hence, the instability was more clearly evident when larger gap sizes were analysed, indicating that small course corrections are present in both groups. Thirdly, when roll and yaw rate were compared, the findings for the roll rate measurements were more prominent. The yaw rate might be important for four-wheeled vehicles, but for two-wheeled vehicles the roll rate seems to be more indicative of alcohol intoxication (Adminaité-Fodor & Jost, 2020; Cain et al., 2016; Feenstra et al., 2010).
It was expected that executive functions, assessed here using the n-back task, would be negatively affected by alcohol intoxication. However, the results revealed that intoxicated participants were almost unaffected by BrAC levels, and that the sober control group’s performance improved over time. It is therefore still argued that intoxication affects executive performance in a negative manner. The learning effect is once again postulated to be at least partly responsible, such that the learning effect hides the performance decrease associated with the intoxication effect. This weakness of the experiment could have been overcome via pre-trial testing of the n-back task. In hindsight, training on the treadmill and the n-back task would clearly have reduced the effects of learning and familiarity. Clearer results would probably have been obtained if participants had had the opportunity to reach their performance asymptote before the first test session.
It is questionable as to how the reduced n-back results (while intoxicated) are related to safe bicycling. Nevertheless, the literature on driving performance (in cars) reveals that executive functions are important for safe driving (Racheva & Totkova, 2020). This experiment reveals that instability is clearly affected and complicates bicycling task performance. It could be the case that alcohol intoxication while bicycling is even more unsafe than when driving a car, as more of an individual’s abilities are used to compensate for stability issues, with less cognitive resources available for relevant decision-making on the bicycle. Hence, bicycling while intoxicated with alcohol may be more difficult than driving a car while intoxicated. The consequences of a crash caused by a car driver versus a bicyclist are of course different.
It was predicted that participants would be less capable of assessing their own abilities with increasing intoxication, and this was also confirmed by the results. However, the correlation analyses did not support the notion that intoxicated participants understand that they are less able when intoxicated on an individual level, as the relation between measured BrAC, subjective ratings of BAC, and ability ratings, at all intoxication assessment time points, were uncorrelated. The expected negative correlation between high intoxication (subjective or objective) and low ability ratings was not obtained. For instance, the participants objective intoxication level was not related to their understanding of their ability.
To relate the results to real-world bicycling, bicycling on the treadmill was combined with self-reports of the participants’ decisions to bicycle in real traffic when intoxicated with alcohol. The results showed that participants had a fairly neutral intention to bicycle in real traffic at the highest level of intoxication they experienced when bicycling on the treadmill. One possible explanation to why their intention to cycle in real traffic was not lower could be their unawareness of their decreased abilities, and the perceived benefits of bicycling (rather than driving); the risks may not be something they necessarily consider (Wallén_Warner et al., 2017). Furthermore, if we consider the legal aspects of bicycling when intoxicated, it is, in the general view preferred, compared to using a car or motor vehicle while intoxicated. The intention to bicycle under the influence of alcohol in real traffic did however weaken when the level of intoxication increased from the alcohol intoxication they experienced during the test to an even higher, hypothetical level of alcohol intoxication. This is in line with previous research (Wallén_Warner et al., 2017), which showed that a person who is so intoxicated with alcohol that s/he can no longer bicycle safely is still expected to have such a good judgment that s/he will refrain from bicycling.
Limitations/weaknesses
One weakness of the study is that it is unclear what measures should be used to assess bicycling stability. It is unclear whether the roll measurement is of more importance than yaw in real life, even if the results clearly point in that direction (as in the study by Cain et al. (2016), performed on training rollers, and the study by Kovácsová et al. (2016), performed on a parking lot). The RR gap size used for the treadmill task could also be questioned (i.e. the 5–25°/s intervals that were used here). Both the validity of the measures and the interaction between yaw and roll under the influence of alcohol need to be studied further.
The between group design chosen with repeated measurements over time has weaknesses. The major weakness is the variance between individuals. All participants should have been bicycling sober and intoxicated. That was problematic since the learning curve discussed would have affected the results. All in all, the chosen design was the best option given the task at hand and the resources available.
Another weakness is the low number of participants for the roll rate measurements in the sober control group. However, statistical analyses were straightforward, regardless of the low numbers. Even if the number of participants were enough in terms of significant statistical results, the low number of participants limits the generalizability of the results. The results should consequently be interpreted with caution and further studies are needed to confirm the obtained results. The effect of non-familiarity and the learning curve became evident during analyses. Practical reasons and the limited time available at the treadmill facilities made it difficult to control for familiarity and learning curves.
Conclusions
The study investigated how alcohol intoxication affects several bicycling-related variables. The results showed that instability increased, and some cognitive functions were impaired, as the level of alcohol intoxication increased. Furthermore, the results indicated that the participants were aware of their decreased capabilities on a group level but not on an individual level. However, the participants still expressed an intention to bicycle in real traffic at the same maximum level of alcohol intoxication experienced when bicycling on the treadmill. The experiment also revealed that stability measures for bicycling needs to be investigated further within the context of intoxication, even if roll rate variation appeared to be most important for the treadmill task in this study. It was also clear that subjective ratings of alcohol intoxication did not correlate with measured BrAC levels.
Glossary
BrAC = breath alcohol concentration
SWRR = steering wheel reversal rate
TPB = theory of planned behaviour
SD = standard deviation
RR = reversal rate
ANOVA = analysis of variance
MSe = mean square error
CRediT contribution statement
Jan Andersson: Conceptualization, Formal analysis, Investigation, Methodology, Project administration, Resources, Writing—original draft.
Christopher Patten: Conceptualization, Funding acquisition, Investigation, Methodology, Project administration, Resources, Writing—review & editing.
Henriette Wallén Warner: Conceptualization, Formal analysis, Funding acquisition, Investigation, Methodology, Project administration, Resources, Writing—original draft.
Caroline Andersérs: Formal analysis, Investigation, Project administration, Resources, Writing—review & editing.
Christer Ahlström: Formal analysis, Writing—review & editing.
Ruggero Ceci: Conceptualization, Funding acquisition¸ Investigation, Writing—review & editing.
Liza Jakobsson: Funding acquisition, Investigation.