Motivations of pedestrians for safe use of highway crossing: an application of the behaviour change model COM-B in Bangladesh
Handling editor: Marjan Hagenzieker, Delft University of Technology, the Netherlands
Reviewers: Oscar Oviedo-Trespalacios, Delft University of Technology, the Netherlands
Sonja Forward, Swedish National Road and Transport Research Institute, Sweden
Received: 24 December 2022; Accepted: 24 November 2023; Published: 12 December 2023
Abstract
In Low- and Middle-Income Countries (LMICs), approximately 93% of global road fatalities occur. As the population of students and workers in these countries continues to grow, walking becomes a prevalent mode of transportation for their daily commutes to schools and workplaces. Bangladesh faces the challenge of pedestrian fatalities, particularly among students and workers, while they cross medium-to-high speed roads during their daily journeys. This research aims to enhance highway crossing design and promote safe crossing behaviour in Bangladesh. The study utilises the COM-B (Capability, Opportunity, and Motivation-Behaviour) model to collect self-reported attitudinal responses from 302 pedestrians who regularly encounter different crossings, including zebra crossings, footbridges, underpasses, and non-priority crossings. These data collection sites are situated along two major highways in Bangladesh. The developed conceptual model in this study focuses on understanding the interplay between Capability, Opportunity, and Motivation, explaining 42% of the variance in the Target Behaviour of safe crossing use and 34.5% in Motivation. The analysis underscores the crucial role of Opportunity in predicting safe crossing use, followed by Motivation and Capability. Furthermore, the study examines the influence of COM-B factors on three essential components of the Target Behaviour: avoiding violations in using nearby crossings, aggressions, and lapses. The findings indicate that physical opportunity plays a vital role in avoiding violations in using nearby crossings, while social opportunity plays a vital role in avoiding aggressions and lapses. Motivation is a key mediator between Capability and Opportunity when predicting safe crossing use. To promote safe crossing practices, designers should focus on Motivation factors such as satisfaction, benefits realisation, and habit formation to maximise the benefits. The study emphasises the necessity for comprehensive interventions, which involve designing pedestrian-friendly infrastructure through various measures. These measures include improving visibility, reducing crossing times, ensuring accessibility, strategically placing traffic signs and fencing, and incorporating refuge areas. Additionally, the study highlights the significant role of social opportunities in safe crossing use by considering appropriate strategies to leverage social elements to motivate pedestrians by involving influential individuals, collaborating with families and institutions, facilitating group crossings, and implementing safety alert reminders. Moreover, social elements impact pedestrians' physical and psychological capabilities for safe crossing practice, as revealed in the study. Overall, the study highlights the potential of the COM-B model and underscores the need for comprehensive interventions to enhance pedestrian safety in LMICs.
Keywords
COM-B model, crossing facilities, LMICs, road fatalities, safe crossing behaviour
Introduction
Around 1.3 million people die yearly due to road traffic crashes, and 20 to 50 million suffer non-fatal injuries worldwide, where vulnerable road users (VRUs) represent half of the road deaths and injuries (1). It is the leading cause of death for children and young adults, aged 5 to 29 years (WHO, 2018). Most collisions involving pedestrians, occur when pedestrians cross the road (Bartolomeos et al., 2013). Studies show that child pedestrian injuries are the highest on school days, especially at times when school starts and ends (Newbury et al., 2008). Similarly, workers mostly travel by road to their workplace, with the last part of the trip completed on foot (Bin, 2014). Every year, around 158 000 workers die from road crashes during commuting (ILO, 2005). A survey carried out by the International Road Assessment Programme (iRAP) in 54 countries found that 88% of pedestrians travel on unsafe roads (WHO, 2018).
Road crashes have become a growing concern with the rapid motorisation in countries with emerging economies (Dı́az, 2002). Unlike High-Income Countries (HICs), student and worker numbers are rising in Low- and Middle-Income Countries (LMICs), and the conflict between pedestrian and vehicular traffic on high-speed roads is increasing (Tiwari, 2020). The World Bank states that 93% of road fatalities occur in LMICs (World Bank, 2019), where pedestrians are the most vulnerable road users due to a lack of protection and limited mode choice. Bangladesh's road traffic fatality rate is 102.1 per 10 000 vehicles and 13.6 per 100 000 population (World Bank, 2020), where 65% of road crashes involve pedestrians (Ahmed et al., 2014). In Bangladesh, educational, industrial and commercial activity adjacent to highways create unsafe crossing attempts for students and workers. Crash data (2006–2015) of Accident Research Institute (ARI) shows that pedestrian casualties happen most while crossing highways (42%) compared to pedestrian activities such as moving along the road-side shoulder (29%), no activity or standing position (19%), and others (10%).
Highway agencies of Bangladesh have installed at-grade crossings such as zebra crossings and grade-separated facilities such as pedestrian footbridges. However, footbridges are inherently anti-pedestrian (Soliz & Pérez-López, 2022). Although it has drawbacks and limitations in the context of broader sustainable development goals, footbridges continue to be widely used infrastructure in LMICs. To improve pedestrian safety in those countries, it is crucial to implement strategies that promote the utilisation of existing footbridges (Hasan & Napiah, 2018). Typically, there are four types of highway crossings available in Bangladesh: pedestrian priority zebra crossings, crossings without priority, footbridges, and underpasses. However, local pedestrians often refuse to use such crossings. Instead, they tend to cross the road along the shortest path (iRAP, 2013). Such practices result from design flaws or individuals' behavioural constraints. Very little research is available on pedestrian behaviour in Bangladesh. A studyRHD (2018) on vulnerable road users at highway intersections shows that pedestrians, mostly jaywalkers, are not using the available pedestrian crossing facilities, even though most have received formal education. Such findings indicate that researchers need to focus more on intentional behaviour. Pedestrians are often faced with a situation in which they are forced to violate formal rules. Violations of traffic rules contribute most to pedestrian-related road traffic crashes (Dı́az, 2002), posing significant traffic safety risks in LMICs, including Bangladesh.
The overall aim of this research is to find the best approach to design interventions that promote the use of crossings by pedestrians while crossing highways. A key objective is to improve the design of crossing facilities and to motivate pedestrians to use them in Bangladesh. This study is also intended to assist designers by providing an appropriate behaviour diagnosis tool to help in predicting pedestrians' safe use of crossings.
Literature review
Behavioural model and measuring scale
In the development of road safety strategy, the application of a component model is more common than other models, such as intervention, sequence, mathematical, process, systems theory, and safety management systems (Hughes et al., 2015). A component model bears a holistic view often described as the traditional four E's (engineering, enforcement, education and encouragement), and a recent development involved the Safe System approach. ‘Safe System’ recognises that a failure within the road system is the root of all road deaths or serious injuries (Salmon et al., 2016). It allows the designers to anticipate and accommodate human error (ITE, 2006). In principle, the Safe System accounts for human mistakes or unintentional actions and some measures against intentional actions, such as enforcement against drivers' speeding. It applies primarily to HICs where intentional acts such as traffic rules violations are less prevalent than in LMICs. In LMICs, the behavioural patterns of road users are substantially different from HICs, with notable issues including non-compliance with traffic regulations (Hamed, 2001), pedestrian violations among young groups (Kadali & Vedagiri, 2013), unpredictable behaviour (Shi et al., 2007), as well as drivers exhibiting unyielding behaviour (Muley et al., 2017).
A few solutions have been found and applied in HICs to enhance the safety of pedestrians. However, the transferability to LMICs is not straightforward due to the variation in behaviour, culture, knowledge, attitude and norms. Though a lack of pedestrian crossing infrastructure is commonly found in countries due to limited resources, governments often are willing to provide the necessary infrastructure to enhance road safety. However, providing pedestrian amenities in a country only guarantees that pedestrians will use them if these amenities meet their expectations. To manage the expectations of users and designers, it is vital to agree on the intervention type(s) and the degree of anticipated behaviour change that design can cause (Nag et al., 2020). In this circumstance, pedestrians could adjust their behaviour to the available intervention options (person-based approach) or suggest to designers' alterations of external factors (system-based approach).
In addressing road safety, low- and middle-income countries (LMICs) often require a combination of person-based and system-based approaches (Batool, 2012). Non-compliance with traffic laws is commonly observed among road users in LMICs. For example, in Iran, a study highlights the importance of adopting a comprehensive system approach to prevent road traffic injuries (Khorasani_Zavareh et al., 2009). This approach is also commonly used in high-income countries (HICs). However, the person-based approach can also effectively promote desirable road user behaviour. A study focusing on mature driver behaviour in countries like the USA, Sweden, Denmark, and the Netherlands demonstrates that community-based approaches and social marketing can effectively address road safety concerns (Waldock, 2008).
Behavioural models have been used in intervention design in multiple forms. Most models focus on individual decision-making, such as the Theory of Planned Behaviour (TPB); others are contextual models, such as the choice architecture model (Shove, 2010). TPB is most widely used model in intervention design. However, many researchers are sceptical about recommending TPB for developing and planning interventions (Taylor et al., 2006; Webb et al., 2010). Furthermore, it is important to recognize that TPB, developed in Western cultural contexts, may be less effective when applied to non-Western cultures due to differences in cultural norms, values, and social influences. While TPB has been successful in explaining behaviour in Asian high-income countries like Taiwan (Hung et al., 2019), its effectiveness may be limited in LMICs (Hendricks & Moghaddam, 2020; Hendriks et al., 2019).
The Behaviour Change Wheel (BCW) framework, which incorporates the Capability, Opportunity, Motivation, and Behaviour (COM-B) model, serves as a comprehensive and theoretically cohesive tool for behaviour change (Michie et al., 2014; Perry et al., 2015). This study employs the COM-B model, which mediates between individual agency and contextual approaches in behaviour change (Niedderer et al., 2014). The COM-B model is an overarching model of different behaviour models (Michie et al., 2011). While most of the model used in the transport safety domains primarily focuses on individual decision-making and cognitive factors, the COM-B model considers individual capabilities and the environmental opportunities and motivations that influence behaviour, leading to more effective and sustainable behaviour change outcomes. That model has widespread uses in intervention development (Barker et al., 2016) and predicting behaviour in various domains (Michail et al., 2021; Miller et al., 2020). In the health domain, a study demonstrated that the capability, opportunity, and motivation constructs of the COM-B model accounted for a substantial portion of the variation in behaviour change interventions and treatment delivery, surpassing other competing behaviour change models, including TPB (Keyworth et al., 2020).
In this study, the research model's target behaviour is the safe use of crossings which needs to be measured with a validated scale. The Pedestrian Behaviour Scale (PBS) was the initial comprehensive questionnaire designed to examine various aspects of pedestrian behaviour across all age groups. It has five dimensions—violations, errors, lapses, aggressive, and positive behaviours—developed by drawing upon several questionnaires and scales. The principal conceptual framework was the Driver Behaviour Questionnaire (DBQ).
The original Driver Behaviour Questionnaire (DBQ) was developed in the United Kingdom. Factor analysis of an original 50-item DBQ (Reason et al., 1990) produced a three-factor solution (n = 520), accounting for 33% of the variance in scores (violations, 22.6%; errors, 6.5%; and lapses, 3.9%). Reason et al. (1990) defined ‘violation’ as intentionally ignoring social norms without intent to injure or create damage; ‘errors’ as the deficiency in knowledge of traffic rules and/or in the inferential processes involved in making a decision; and ‘lapses’ as an unintentional deviation from practices related to carelessness or a lack of concentration. Subsequent studies by the same team in Manchester introduced a distinction between two kinds of violations. The first category includes violations that involve a deliberate breaking of the Highway Code and/or the law. Overtly aggressive acts, on the other hand, encompass behaviours such as speeding and overtaking.
PBS also used the Aggressive Driver Behaviours Scale (Lawton et al., 1997), which defined ‘aggressive behaviour’ as a tendency to misinterpret other road users’ behaviour resulting in the intention to annoy or endanger, and the Positive Driver Behaviours Scale (Özkan & Lajunen, 2005) which defined ‘positive behaviour’ as the behaviour that seeks to avoid violation or error and/or seeks to ensure traffic rule compliance. The pedestrian behaviour scale (PBS) is validated to quantify injury risk behaviours in pedestrians of all ages (Granié et al., 2013), where ‘Aggression’ is defined as aggressive actions towards other road users (Granié et al., 2013). Deb et al. (2017) used the 43-item PBS to develop and validate a short version, having 20-items, of the pedestrian behaviour questionnaire (PBQ) for the US population, which was later applied worldwide.
Pedestrians' safety factors
A comprehensive review of objective and subjective studies (2000–2020) found that high traffic speed, high traffic volume and long distances to/from the school create unsafe conditions for children (Amiour et al., 2022). In behavioural studies, a meta-analysis by Rasouli and Tsotsos (2020) classified pedestrian behaviour using a large subset of crucial studies (1953–2017). That analysis found that pedestrian attributes (54% of studies) and environmental factors (46% of studies) are two broad categories that govern typical pedestrian behaviour, where physical contexts (road characteristics, signal control, weather, crossing type and location), dynamic factors (gap acceptance, communication, vehicle speed and distance) and demographics (age and gender) are the major contributing factors. Other factors included pedestrian speed, attention, group size, social norms, pedestrians flow, imitation, social status, law compliance, culture, experience and faith, distance and speed, traffic volume, vehicle type, and law enforcement. Another review focused on studies on pedestrian-vehicle collisions (Amini et al., 2019), where dynamic factors, especially vehicle speed, emerge as the most influential to pedestrians' negotiation and decision-making process.
While there is a long history of research on road safety in high-income countries, research in LMICs has started growing since 2008 (Haghani et al., 2022). Among the limited road safety research studies, Haghani et al. (2022) introduced influential pedestrian safety-related studies that broadly focused on road crashes, pedestrians' behaviour, risk perception, culture, driver yielding, enforcement and policy. Reviewing fifty-one such studies, it is found that profession is one of the key demographic factors in LMICs, including age and gender. Students and workers of the young population group are most vulnerable due to the land use pattern and highway exposure. It indicates that the roadside built environment is also a major factor in LMICs for the safety of pedestrians. Additionally, design weaknesses and lack of ownership of road furniture among road users magnify pedestrians' safety problems.
Motivation for behaviour change
Behavioural models are often criticised for the intention-behaviour gap when they apply to change behaviour. An implementation intention is one of the key strategies to provoke behaviour modification. It connects a given behaviour to a particular circumstance: ‘If X occurs, then I will do Y’. It can be used to develop new habits and has proven helpful in various circumstances (Adriaanse et al., 2011; Gollwitzer, 1999). A combined psychological model (Fylan, 2017) emphasises the importance of identifying barriers and facilitators to a target behaviour to fill the gap between intention and behaviour. Motivation, the most influential element in the COM-B model, could act as a vehicle to break the barriers in achieving target behaviour. Personality traits and psychological needs influence motivation, where emotions (as included in the combined model) serve as motives to change behaviour. There are several other factors proven to affect individuals' motivations, including persuasive and motivational messages (Anderson, 2011), praise (Robins, 2012), action planning (Mistry et al., 2015), copying others or social identity function (Meltzoff & Moore, 2002), good street crossing habits (Fujii & Gärling, 2005) and moral stance on good or bad (Kroll & Egan, 2004).
However, the transformation of one's behaviour depends on the successful interaction of the push (internal psychological process) and pull (external enforcement, social or environmental factor) mechanism within motivation (Deckers, 2018). Intervention designers often fail to understand such mechanisms because design approaches are based on psychologically naive theoretical assumptions (Harrison, 2008) (e.g. high-risk takers have identical psychological traits) about behaviour and behaviour change. Intervention design with a simple premise will not bring about an anticipated change to the risk-taker group, where motivation is much needed to alter their behaviour. While motivation is the key driver of behaviour change, there needs to be more information from road safety research to understand the strength of motivational elements, particularly social and psychological ones.
Research model and hypotheses
A 20-item PBQ version has been tested to validate all dimensions in a Southeast Asian study (Mcilroy et al., 2019). That study recommended a short version, a 12-item PBQ with three behavioural dimensions: violations, aggressions and lapses, valid for six culturally different countries, including Bangladesh.
This study incorporated those 12 items of PBQ as formative COM-B items of the target behaviour. They were clustered into four typical behavioural questions: the use of a nearby crossing (e.g. violations in using zebra or footbridge), other violation items (e.g. diagonal crossing), aggression (e.g. anger expression to the driver), and lapses items (e.g. forgetting the crossing norms).
This study used an adapted COM-B model as a conceptual research framework (Figure 1). A hypothetical COM-B latent 7-factor (physical capability, psychological capability, physical opportunity, social opportunity, reflective motivation, automatic motivation, and TB) model is first employed in this study. Later, a second-order 4-factor (Capability, Opportunity, Motivation, and Target Behaviour) model is formed.
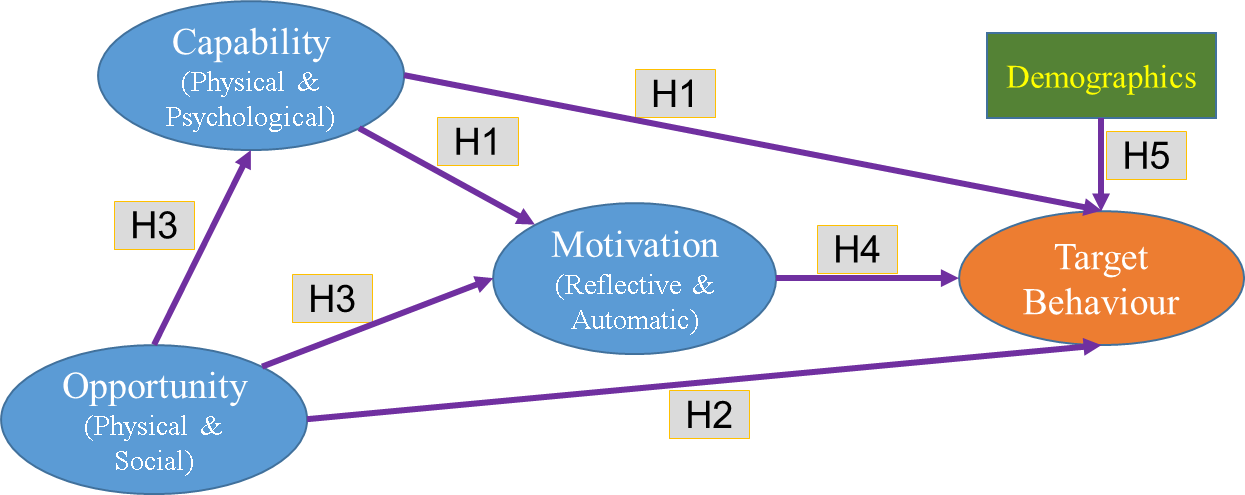
The application of the COM-B model is limited in the health domain. A study in seven countries (Australia, China, India, Indonesia, Saudi Arabia, South Africa, and the United Kingdom) examined the predictive relationships between COM-B components and children's handwashing (Schmidtke & Drinkwater, 2021). Except for China, in all countries analysed, at least one component of the COM-B model was found to be a significant predictor, with Saudi Arabia having up to three significant components. Australia, Indonesia, and South Africa showed that only Capability was significant, while India demonstrated significance for Capability and Opportunity. In the UK, Capability and Motivation were found to be significant. Another study conducted in the UK specifically identified the motivation component of the COM-B model as the most influential factor (Miller et al., 2020). However, most studies have been performed in HICs (Lydon et al., 2019). According to the drive theory of motivation, all behaviour results from primary physiological demand or fulfilment of basic needs following Maslow's hierarchy of needs. Therefore, the predictive power of COM-B elements in LMICs with limited opportunities could differ from HICs. This study conceptualised the original COM-B paths' directions and added a path from Opportunity to Capability (annotated as H3 in Figure 1). This study analyses the data to assess the following hypotheses (H1–H5):
-
H1. Capability will positively predict Motivation and Target Behaviour. Pedestrians with sufficient physical strength or stamina (physical capability), or who know the traffic rules, or who have other psychological skills (psychological capability), such as correct estimation of vehicle speed and distances, will be more motivated to use crossings safely. However, the contribution to Motivation and Target Behaviour from physical and psychological capability could be different.
-
H2. Opportunity will be the strongest positive predictor of Target Behaviour compared with Capability and Motivation. When pedestrians find physical crossing facilitates (physical opportunity) such as convenient locations, safety devices or other road furniture that facilitate their safe crossings, they will be more likely to use the designated crossings. Favourable social support (social opportunity) from family, institutions, or locals could be stronger reasons to achieve target behaviour. Hence, both physical and social opportunities will significantly affect the Target Behaviour.
-
H3. Opportunity will positively impact Capability and Motivation. Individuals in a favourable environment (physical and social) will be more capable and more motivated to use crossings safely. They will walk or use stairs for physical exercise and be more likely to improve their crossing skills, knowledge about traffic rules, or their judgement. They will get confidence, satisfaction, and good feelings in using the crossings. However, the contribution of physical or social opportunity to Capability could have minimal effect, as the original model did not explicitly acknowledge the effect of Opportunity on Capability.
-
H4. Motivation will positively predict Target Behaviour and is the most potent mediator of the model. When pedestrians see the benefits or become satisfied with safe crossings (reflective motivation), or when their habits develop (automatic motivation), they could be motivated to perform the target behaviour. Both Capability and Opportunity will affect Target Behaviour strongly using the Motivation upon which the original model is framed.
-
H5. Students and workers are more exposed to the risky environment in LMICs, as they need to travel more to their places of study/work. The age group above 18 are primarily workers. Therefore, among five demographic variables (age, gender, profession, marital condition and having children), age or profession will significantly impact the Target Behaviour.
Methodology
Questionnaire development
Few COM-B questionnaires to date have tested acceptability, reliability or validity. Keyworth et al. (2020) used a short version of a generic 6-item self-evaluation COM questionnaire in the health domain where predictive validity is tested for the first time. That questionnaire tied each construct with the target behaviour by explaining each COM-B construct using examples or indicators. For example, ‘I am physically able [capability construct] to make every contact count [target behaviour]’ was the statement with the indicators (e.g. ‘I have sufficient physical stamina’, ‘I can overcome disability’, ‘I have sufficient physical skills’). To evaluate the applicability of that questionnaire, the survey was tested on a sample of individuals from a low socioeconomic background. The individuals with low socioeconomic status found the questionnaire to be easily comprehensible, engaging, and well-balanced.
There is no standardised measurement tool for COM-B constructs in the road safety domain; therefore, it was necessary to opt for a formative approach where indicators predict the construct. This study used the theoretical domains framework (TDF) to guide the COM-B construct formation. The TDF consists of 14 domains: knowledge; skills; social/professional role and identity; beliefs about capabilities; optimism; beliefs about consequences; reinforcement; intentions; goals; memory, attention and decision processes; environmental context and resources; social influences; emotions; and behavioural regulation. TDF does not establish correlations between domains which is suited for formative construct. COM-B or TDF assessment is considered a required behavioural diagnosis tool in designing interventions.
TDF can readily be mapped to the COM-B and covers the range of behavioural determinants (Cane et al., 2012). A reliable TDF-based questionnaire will increase the value of theory in evaluating barriers and facilitators for implementation (Michie et al., 2005). Therefore, TDF domains were mapped with the COM-B items, following the validated COM questionnaire structure. However, that questionnaire emphasised the construct rather than factors. A recommended typical COM-B Questionnaire (Michie et al., 2014), comprising various factors, is followed before mapping various factors within the COM questionnaire structure. The Sample questions for making a COM-B diagnosis (West et al., 2020) also help to form questions within respective TDF mapping with the indicators that predict each COM-B construct. For each questionnaire statement, this study used the tested behavioural modification technique of the ‘If X occurs, then I will perform Y’ cause-and-effect relationship between constructs and indicators, as mentioned in section 2.3. This study used a 5-point Likert scale in the questionnaire as it improves response rate and quality, lessens respondents' frustration level (Buttle, 1996), and is easily understandable to the respondents.
A preliminary questionnaire was piloted in two rounds with a small target population (pedestrians) to incorporate the highest number of factors for formative constructs. The logic behind this approach is that too many indicators could lead to less reliable responses on the questionnaire (Galesic & Bosnjak, 2009). After analysing the outcome of the pilot questionnaire, the COM-B questionnaire items were finalised with the experts (supervisors of the lead researcher), checking content for consistency and validity. The final version contained forty-one COM-B questionnaire item statements (Appendix A). A 5-point bipolar Likert agreement scale ranging from -2 strongly disagree to +2 strongly agree to measure the agreement level on the different statements related to physical opportunity (PO), social opportunity (SO), reflective motivation (RM), automatic motivation (AM), physical capability (PC), and psychological capability (PsC). Another 5-point Likert frequency scale was used to measure the target behaviour (TB) with four statements. The COM-B questionnaire also included demographic items such as gender, profession, having children or not, marital status, and age. The questionnaire items that were translated from English to Bengali underwent a backwards translation process, which involved verifying the translations by road safety experts and colleagues who were independent in giving their input.
Survey locations, procedure and sample
The target pedestrian groups of pedestrians, students and workers used one of the four crossing sites near their institutions, industries or marketplace (Figure 2). These include the zebra crossing site (location 1) at Dendabor, the footbridge and underpass site (location 2) at Bipyl on the N540 highway, the Narshingdi Abdul Kader Mollah School zebra crossing site (location 3), and the Morjal zebra crossing site (location 4) on the N2 highway.
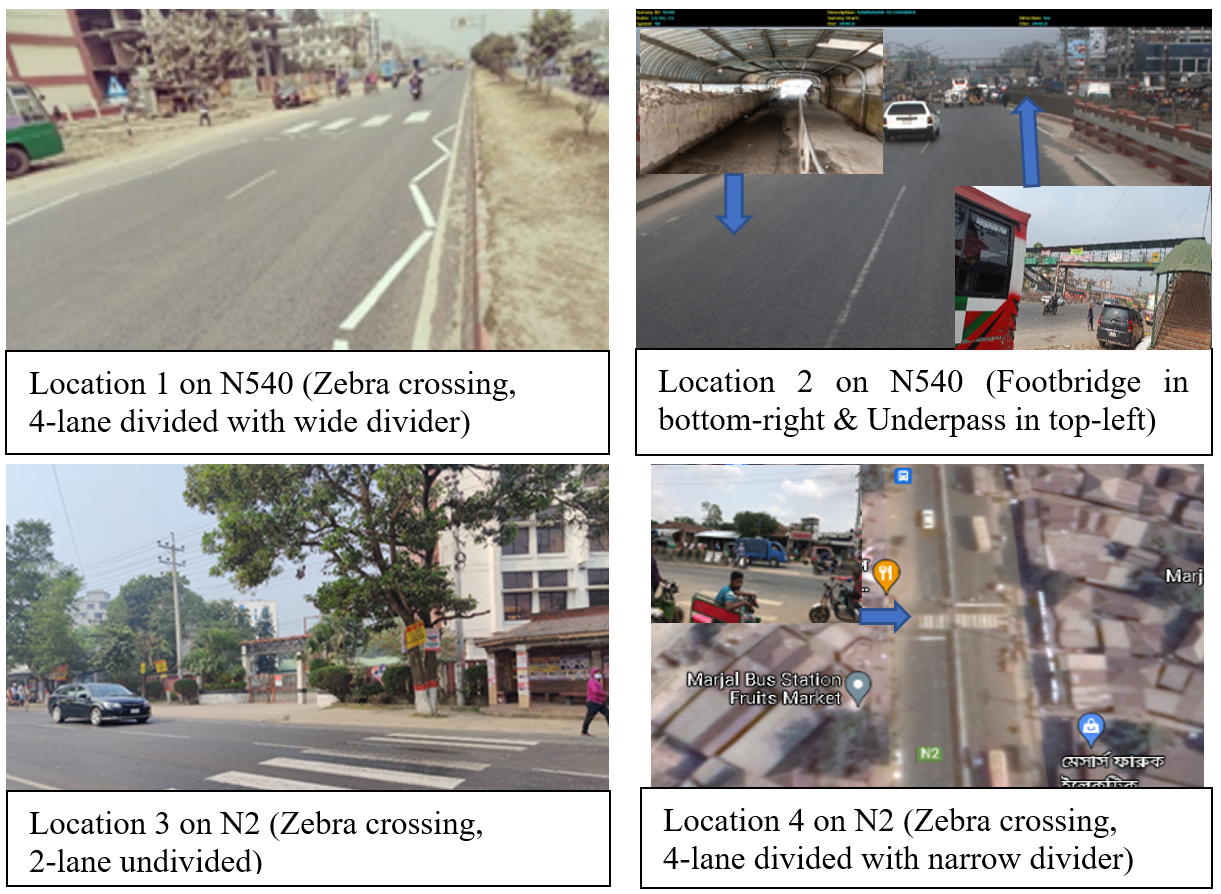
Site 1 is a zebra crossing on a four-lane divided highway in a semi-urban area in front of a school. The crossing is equipped with traffic signs, road markings, and a spacious median refuge area. Site 2, also in a semi-urban area, is 500 meters away and includes an underpass and a footbridge. The underpass has a dedicated lane for non-motorized vehicles and a separate pedestrian footpath, with traffic signs at the entrance. The footbridge is designed with a height clearance of 5.7 meters above the road level, following the Roads and Highways Department (RHD) standards. There are several nearby garment industries near sites 1 and 2. Site 3 is located on a rural highway and consists of a zebra crossing with traffic signs in front of a college. In site 4, another zebra is crossing within a 200-meter-long widened 4-lane highway segment in a marketplace area on the same rural highway.
The researcher and his team visited investigation sites and nearby institutions such as schools, industries and the marketplace. With the help of local road agencies and institutional representatives, such as school teachers and industry managers, the researcher distributed the questionnaire with a participant information sheet. The lead researcher and his team collected data between December 2021 and March 2022.
The researcher collected data on the respondents' self-reported pre-COVID (before March 2020) behaviour and attitude. Any data during the COVID period could not reflect the normal situation. The respondents are familiar with the research sites due to their daily travel to their institutions, so they could easily recall their pre-COVID behaviour. The lead researcher and his team distributed four hundred paper-based questionnaires to the students and garment workers through the institutional representatives, which were collected later by the research team. The research team took on-the-spot responses from the marketplace workers and others. There were four research locations on two national highways (N-540 and N-2) in Bangladesh. Respondents were familiar with at least one of the four crossing facilities (zebra crossing, footbridge, underpass, and non-priority type). A total of 127 students, 145 workers, and 30 respondents from other professions filled out the questionnaire. The total sample size was 302, including students' online responses (n = 4), with a response rate of 75.5%. Large respondent groups were male (54%), aged 12 to 18 years (40.7%), unmarried (50.3%) and childless (59.2%). Among the respondents, 156 had at-grade crossings nearby, with 141 being near zebra crossings and the remaining non-priority crossings. On the other hand, 146 respondents were located near grade-separated crossings, with 106 near footbridges and 40 near underpasses.
Results
Analysis procedure
Data cleaning steps were accomplished before using SmartPLS 4 software, followed by normality checks. Model variables were tested with statistical tests using SPSS, including PLS-SEM and regression analysis using smartPLS for each target variable item.
The combination of partial least squares (PLS) and structural equation modelling (SEM) enabled the assessment of the formative measurement model of the COM-B and the constructs' predictive validity. Smart PLS-SEM, a robust estimation method, is suitable for complex relationships, violations of normality assumptions, and small sample sizes. The default settings of the PLS algorithm were used to obtain the weights for the initial model's outer (i.e. the measurement model) and inner model (i.e. the path model of the constructs). Multicollinearity within the inner and outer model was minimal as the variance inflation factor (VIF) was less than the ideal and most conservative threshold of 3.0 (Becker et al., 2015).
The lower order model was established through initial model trimming by removing statistically non-significant (outer weight p > 0.05 and outer loading < 0.5) items and insignificant inner model paths (p > 0.1) stepwise. Later, a higher-order model was formed based on the lower model constructs, and a similar procedure was followed as followed in the lower-order model. The p-value was set at 0.05 for interpreting the results, except for the lower-order model, which was set at 0.1. The standardised root mean square residual (SRMR) was used to assess overall model fits, with 0.08 being the acceptable threshold. The R2 and Q2 values were used to describe the models' in-sample explanatory power and out-of-sample predictive power, respectively.
Model variables with statistical tests
The target variable, consisting of four items, was measured with a 5-point Likert scale ranging from 1 (never) to 5 (always). They were:
-
the uses of nearby crossing (TB1)
-
violation behaviours such as crossing diagonally from or using prohibited crossing paths (TB2)
-
aggressive behaviours such as walking slowly, yelling at drivers, or gesturing rudely, and hitting a vehicle (TB3)
-
road safety lapses, such as failing to pay attention or look at the traffic properly because of talking to someone or using a mobile phone, joining someone on the opposite side etc. (TB4)
The descriptive statistics of the target behavioural items, including their mean, range, and standard deviation, are presented in Table 1.
|
Variable items |
Response |
Frequency (N = 302) |
Percentage |
|---|---|---|---|
|
Uses of nearby crossing (TB1) Mean: 3.78 Standard deviation: 0.79 Range (4.0) |
Never |
1 |
0.3% |
|
Infrequent |
14 |
4.6% |
|
|
Sometimes |
88 |
29.1% |
|
|
Frequent |
147 |
48.7% |
|
|
Always |
52 |
17.2% |
|
|
Violation behaviour (TB2) Mean: 2.16 |
Never |
55 |
18.2% |
|
Infrequent |
161 |
53.3% |
|
|
Sometimes |
69 |
22.8% |
|
|
Frequent |
17 |
5.6% |
|
|
Always |
0 |
0% |
|
|
Aggression (TB3) Mean: 1.94 Standard deviation: 0.89 Range: 4.0 |
Never |
109 |
36.1% |
|
Infrequent |
120 |
39.7% |
|
|
Sometimes |
58 |
19.2% |
|
|
Frequent |
12 |
4.0% |
|
|
Always |
3 |
1.0% |
|
|
Lapses (TB4) Mean: 2.13 Standard deviation: 0.74 Range: 3.0 |
Never |
56 |
18.5% |
|
Infrequent |
162 |
53.6% |
|
|
Sometimes |
74 |
24.5% |
|
|
Frequent |
10 |
3.3% |
|
|
Always |
0 |
0% |
The target behaviour in the conceptual research model is the safe use of crossings, constructed with four indicators (TB1, TB2*, TB3*, and TB4*). TB2, TB3 and TB4 were measured with a reversed scale. Therefore, the target behavioural items TB2, TB3, and TB4 have been reversed as indicated by * (TB2*, TB3*, and TB4*) to represent the target behaviour with avoiding—violations, aggressions, and lapses. The PLS-SEM found the relative strength of each latent construct in predicting the target behavioural items, where indicators of each construct were finalised after trimming unreliable indicators. The regression analysis found the significant contributory indicators in predicting the target behavioural items (TB1, TB2*, TB3*, and TB4*):
1. Concerning TB1: While predicting TB1, three items (PC1–3) support the physical capability construct. Similarly, psychological capability with three (PsC2–4), physical opportunity with seven (PO1, PO3–5, PO8–10), social opportunity with four (SO1-3, SO5), reflective motivation with seven (RM1–3, RM5–8), and automatic motivation with five (AM1–5). The dominant factors of those constructs were PC1(outer weight = 0.642), PC3 (outer weight = 0.570), PsC2 (outer weight = 0.727), PsC3 (outer weight = 0.333); PO8 (outer weight = 0.545), PO1 (outer weight = 0.238), SO1(outer weight = 0.324), SO5 (outer weight = 0.474), RM2 (outer weight = 0.578), RM5 (outer weight = 0.333); AM2 (outer weight = 0.479), AM3 (outer weight = 0.367) with the lowest outer weight 0.019. The total effect of physical opportunity (TE = 0.330) on avoiding violations in the use of nearby crossings was the highest compared to other constructs. The total effects (TE) ranged from -0.009 for automatic motivation (AM) to 0.181 for reflective motivation (RM). Regression analysis found that PO1 (β = 0.132, p < 0.05), PO3 (β = 0.157, p < 0.05), PO8 (β = 0.216, p < 0.01), RM2 (β = 0.268, p < 0.001), and PsC3 (β = 0.106, p < 0.05) had significant positive contributions, explained 43.9% variance (R2 = 0.439) in TB1.
2. Concerning TB2*: While predicting TB2*, the physical capability construct is supported with four items (PC1–4). Similarly, psychological capability with three (PsC2–4), physical opportunity with six (PO2–4, PO6, PO8, PO10), social opportunity with five (SO1–5), reflective motivation with five (RM1–3, RM5, RM8), and automatic motivation with five (AM1–5). The dominant factors of those constructs were PC1(outer weight = 0.853), PC4 (outer weight = 0.195), PsC2 (outer weight = 0.727), PsC3 (outer weight = 0.333); PO3 (outer weight = 0.506), PO8 (outer weight = 0.419), SO3 (outer weight = 0.366), SO5 (outer weight = 0.295), RM5 (outer weight = 0.796), RM8 (outer weight = 0.209); AM3 (outer weight = 0.385), AM5 (outer weight = 0.318) with the lowest outer weight 0.029. The total effect of physical capability (TE = 0.197) on avoiding other violations (apart from TB1) was the highest compared to other constructs. The total effects (TE) ranged from 0.044 for psychological capability (PsC) to 0.230 for reflective motivation (RM). Regression analysis found that SO1(β = 0.159, p < 0.05), SO5 (β = 0.139, p < 0.05), RM5 (β = 0.197, p < 0.05), and PC1 (β = 0.169, p < 0.05) had significant positive contribution, explained 24.3% variance (R2 = 0.243) in TB2*.
3. Concerning TB3*: While predicting TB3*, the physical capability construct is supported with four items (PC1–4). Similarly, psychological capability with three (PsC2–3, PsC5), physical opportunity with five (PO4, PO6, PO8–10), social opportunity with four (SO1, SO3, SO4-5), reflective motivation with five (RM1, RM3, RM5, RM7–8). However, no contribution was found from the automatic motivation. The dominant factors of those constructs were PC1 (outer weight = 0.565), PC3 (outer weight = 0.293), PsC3 (outer weight = 0.753), PsC5 (outer weight = 0.382); PO4 (outer weight = 0.704), PO6 (outer weight = 0.495), SO4 (outer weight = 0.399), SO1 (outer weight = 0.382), RM5 (outer weight = 0.527), RM3 (outer weight = 0.491); with the lowest outer weight 0.016. The total effect of social opportunity (TE = 0.227) on avoiding aggression was the highest compared to other constructs. The total effects (TE) ranged from 0.013 for psychological capability (PsC) to 0.162 for physical opportunity (PO). Regression analysis found that PO4 (β = 0.155, p < 0.05), PO6 (β = 0.133, p < 0.05), SO1 (β = 0.188, p < 0.05), and RM3 (β = 0.172, p < 0.05) had significant positive contributions, explained 27.6% variance (R2 = 0.276) in TB3*.
4. Concerning TB4*: While predicting TB4*, the physical capability construct is supported with four items (PC1–4). Similarly, psychological capability with four (PsC2–5), physical opportunity with six (PO3–5, PO8–10), social opportunity with four (SO1, SO3, SO4–5), reflective motivation with seven (RM1–5, RM7–8), and automatic motivation with four (AM1–4). The dominant factors of those constructs were PC3 (outer weight = 0.702), PC1 (outer weight = 0.430), PsC3 (outer weight = 0.726), PsC5 (outer weight = 0.379); PO4 (outer weight = 0.486), PO9 (outer weight = 0.351), SO3(outer weight = 0.587), SO5 (outer weight = 0.420), RM5 (outer weight = 0.559), RM1 (outer weight = 0.405); AM2 (outer weight = 0.618), AM3 (outer weight = 0.431) with the lowest outer weight 0.019. The total effect of social opportunity (TE = 0.179) on avoiding lapses was the highest compared to other constructs. The total effects (TE) ranged from 0.096 for physical opportunity (PO) to 0.139 for psychological capability (PsC). Regression analysis found that SO3 (β = 0.152, p < 0.05), AM2 (β = 0.154, p < 0.05), and PsC3 (β = 0.194, p < 0.01) had significant positive contributions, explained 29.4% variance (R2 = 0.294) in TB4*.
The study revealed significant correlations between motivational factors and behavioural components related to safe crossing use. Satisfaction for crossing use was found to have a positive correlation with TB1 (r = 0.360, p < 0.001) and TB4* (r = 0.159, p < 0.01). Similarly, the safety priority over convenience was found to be positively correlated with TB1 (r = 0.283, p < 0.001), TB3* (r = 0.204, p < 0.001), and TB4* (r = 0.243, p < 0.001). Habit was found to have a positive correlation with TB1 (r = 0.295, p < 0.001), TB3* (r = 0.121, p < 0.05), and TB4* (r = 0.242, p < 0.001). Guilty or good feeling was found to have positive correlation with TB1 (r = 0.272, p < 0.001), TB3* (r = 0.128, p < 0.05), and TB4* (r = 0.162, p < 0.01). Thinking as a benefit from avoiding risky crossings was found to be positively correlated with TB1 (r = 0.263, p < 0.001), TB3* (r = 0.184, p < 0.01), and TB4* (r = 0.158, p < 0.01). Lastly, planning for improving behaviour was found to have a positive correlation with TB1 (r = 0.199, p < 0.01) and TB4* (r = 0.235, p < 0.001).
Among the physical capability factors, the ability to walk showed a positive correlation with TB1 (r = 0.245, p < 0.001), TB3* (r = 0.176, p < 0.01), and TB4* (r = 0.208, p < 0.001). Similarly, strength exhibited a positive correlation with TB1 (r = 0.202, p < 0.001), TB3* (r = 0.166, p < 0.01), and TB4* (r = 0.277, p < 0.001). As psychological capability factors, mood control in assertive crossing showed a positive correlation with TB1 (r = 0.162, p < 0.01), TB3* (r = 0.162, p < 0.01), and TB4* (r = 0.136, p < 0.05). Similarly, paying attention or thinking before crossing exhibited a positive correlation with TB1 (r = 0.264, p < 0.001), TB3* (r = 0.136, p < 0.05), and TB4* (r = 0.299, p < 0.001). The knowledge of traffic rules had positive corelation with TB1 (r = 0.244, p < 0.001) and TB4* (r = 0.182, p < 0.01). Lastly the knowing the provision of fines for violations had positive correlation with TB4* (r = 0.141, p < 0.05).
Various physical opportunities such as the visibility of drivers showed a positive correlation with TB1 (r = 0.365, p < 0.001), TB3* (r = 0.139, p < 0.05), and TB4* (r = 0.159, p < 0.01). Similarly, short crossing time had a positive correlation with TB1 (r = 0.159, p < 0.01) but a negative correlation with TB3* (r = -0.116, p < 0.05). Easy access and usability in all weather conditions were positively correlated with TB1 (r = 0.332, p < 0.001) and TB4* (r = 0.166, p < 0.01). The presence of traffic signs and road markings showed a positive correlation with TB1 (r = 0.295, p < 0.001), TB3* (r = 0.182, p < 0.01), and TB4* (r = 0.214, p < 0.001). The availability of waiting areas in the middle or at the side of the road exhibited a positive correlation with TB1 (r = 0.318, p < 0.001), TB3* (r = 0.138, p < 0.05), and TB4* (r = 0.195, p < 0.01). Pedestrian fences on footpaths or medians positively correlated with TB3* (r = 0.122, p < 0.05). Lastly, the convenient location also had significant correlations with TB1 (r = 0.286, p < 0.001) and TB4* (r = 0.131, p < 0.05).
The presence and influence of influential people in crossing use showed a positive correlation with TB1 (r = 0.208, p < 0.001), TB3* (r = 0.144, p < 0.05), and TB4* (r = 0.157, p < 0.01). Similarly, education and support from family/institutions exhibited a positive correlation with TB1 (r = 0.308, p < 0.001), TB3* (r = 0.299, p < 0.001), and TB4* (r = 0.265, p < 0.01). The parental safety alert reminders exhibited a positive correlation with TB1 (r = 0.260, p < 0.001), TB3* (r = 0.263, p < 0.001), and TB4* (r = 0.323, p < 0.001). The presence of many users in crossing or group crossings at specific times showed a positive correlation with TB1 (r = 0.226, p < 0.001), TB3* (r = 0.302, p < 0.001), and TB4* (r = 0.242, p < 0.001). Lastly, many known users using the crossing also had significant correlation with TB1 (r = 0.233, p < 0.001), TB3* (r = 0.233, p < 0.001) and TB4* (r = 0.177, p < 0.01).
However, there could have been significant differences based on the crossing types (e.g. at-grade vs. grade-separated crossings). The Mann-Whitney U test showed a statistically significant difference between the two groups on TB3* (U = 8223, p < 0.001, r = -4.441) and TB4* (U = 9402, p < 0.01, r = -2.89), while others (TB1 & TB2*) were not significant.
Lower order model
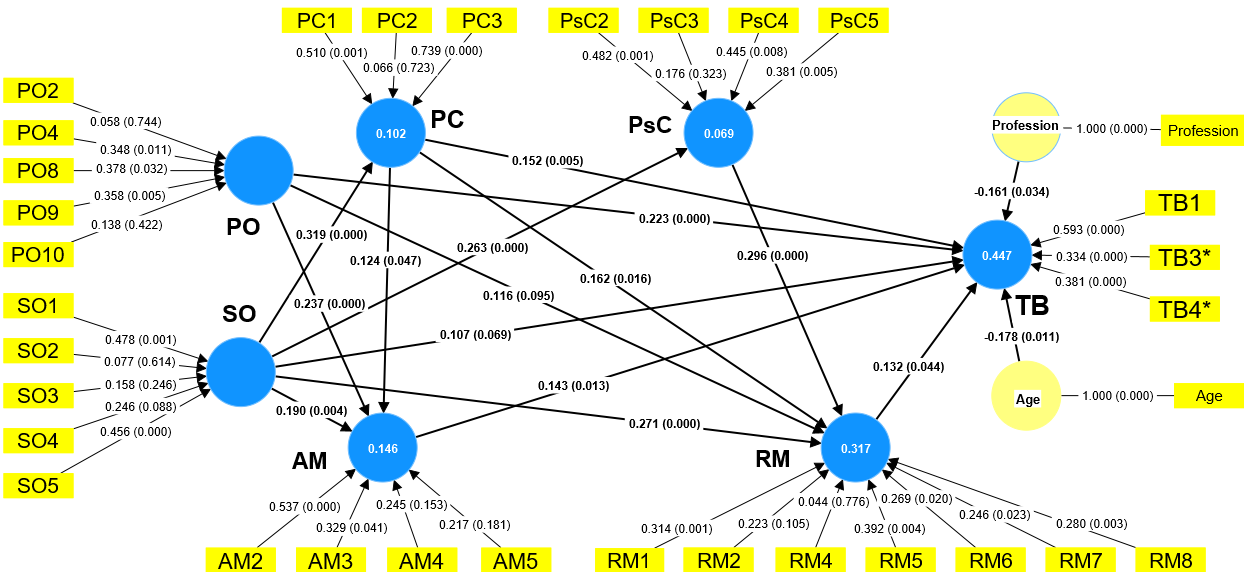
After trimming three non-significant inner model paths (physical opportunity to physical capability; and psychological capability to automatic motivation and target behaviour) from the initial model, and ten statistically non-significant items (PC4, PsC1, PO1, PO3, PO5-7, RM3, AM1, and TB2) from the outer model, a lower order model was established with a good model fit (SRMR = 0.057). Figure 3 shows the lower-order model with the weight and p-value for the outer model, and the beta (β) and p-value (in parentheses) for each path of the inner model. All abbreviations in Figure 3 are expanded in Appendix B.
The lower-order conceptual prediction model confirmed that the most contributory elements in the respective constructs were:
-
Safe crossing use (TB): crossing use (TB1) with outer weight = 0.593 (p < 0.001), avoiding lapses (TB4*) with outer weight = 0.381 (p < 0.001), and avoiding aggression (TB3*) with outer weight = 0.334 (p < 0.001)
-
Physical capability (PC): strength (PC3) with outer weight = 0.739 (p < 0.001) and the ability to walk (PC1) with outer weight = 0.510 (p < 0.01)
-
Psychological capability (PsC): knowledge of traffic rules (PsC4) with outer weight = 0.445 (p < 0.01), mood control in assertive crossing (PsC2) with outer weight = 0.482 (p < 0.01), and knowing the provision of fines for violations (PsC5) with outer weight = 0.381 (p < 0.01)
-
Physical opportunity (PO): visibility to drivers (PO8) with outer weight = 0.378 (p < 0.05), refuge area on a highway (PO9) with outer weight = 0.358 (p < 0.01), and traffic sign and road marking (PO4) with outer weight = 0.348 (p < 0.05)
-
Social opportunity (SO): support from family/institution (SO1) with outer weight = 0.478 (p < 0.01), crossing uses by influential peoples (SO5) with outer weight = 0.456 (p < 0.001), and group crossing (SO4) with outer weight = 0.246 (p < 0.1)
-
Reflective motivation (RM): safety priority (RM5) with outer weight = 0.392 (p < 0.01), planning (RM1) with outer weight = 0.314 (p < 0.01), imitation (RM8) with outer weight = 0.280 (p < 0.01), persuasion from awareness campaign (RM6) with outer weight = 0.269 (p < 0.01), and reward/praise for using the crossing (RM7) with outer weight = 0.246 (p < 0.01)
-
Automatic motivation (AM): habit (AM2) with outer weight = 0.537 (p < 0.001), feelings in crossing use (AM3) with outer weight = 0.329 (p < 0.05).
The cross-loadings check confirmed that each formative indicator was strongly associated with the assigned construct and suggested sufficient discriminant validity. Multicollinearity was not a problem in the inner or outer model (VIF < 3). The Q2 values of all endogenous constructs are greater than zero, and the Q2 (value = 0.336) of the target behaviour indicates that the model has adequate predictive power.
The lower-order model's path analysis confirmed the significant contribution of various exogenous latent constructs in predicting endogenous latent constructs (AM, RM, PC, PsC, and TB), including the influences of demographic variables on the target behaviour. They were:
-
Physical opportunity (β = 0.237, p < 0.001), social opportunity (β = 0.190, p < 0.01), and physical capability (β = 0.124, p < 0.05) significantly predicted automatic motivation with 14.6% explained variance.
-
Social opportunity (β = 0.271, p < 0.001), psychological capability (β = 0.296, p < 0.001), and physical capability (β = 0.162, p < 0.05) significantly predicted reflective motivation with 31.7% explained variance.
-
Social opportunity (β = 0.319, p < 0.001; β = 0.263, p < 0.001) significantly predicted physical and psychological capability with 10.2% and 6.9% explained variance, respectively.
-
Physical capability (β = 0.152, p < 0.01), physical opportunity (β = 0.223, p < 0.001), social opportunity (β = 0.107, p < 0.1), automatic motivation (β = 0.143, p < 0.05), reflective motivation (β = 0.132, p < 0.05), and demographic variables (age: β = -0.178, p < 0.05); and profession: β = -0.161, p < 0.05) significantly predicted the target behaviour with 44.7% explained variance.
Mediation analysis of lower-order model paths has been shown in Appendix C. Mediation results showed that physical capability (PC) had no mediation to the target behaviour (TB) through automatic motivation (β = 0.018, p > 0.1) and reflective motivation (β = 0.021, p > 0.1); instead, a direct relationship was established between PC and TB with β = 0.152 (p < 0.01). Psychological capability (PsC) had full mediation through reflective motivation (β = 0.039, p < 0.1) to the target behaviour as the PsC–TB and PsC–AM were trimmed from the model due to insignificant contributions. Physical opportunity (PO) had no mediation to the TB through reflective motivation (β = 0.015, p > 0.1). However, PO was partially mediated to the TB through automatic motivation (β = 0.034, p < 0.05). Social opportunity (SO) partially mediates TB through automatic motivation (β = 0.027, p < 0.1), reflective motivation (β = 0.036, p < 0.1), and physical capability (β = 0.048, p < 0.05). However, no mediation was established through the SO–PC–AM–TB, SO–PC–RM–TB, and SO–PsC–RM–TB routes as PC–AM, PC–RM, and PsC–RM had insignificant contributions in mediation with β = 0.007 (p > 0.1), β = 0.007 (p > 0.1), and β = 0.010 (p > 0.1), respectively.
Higher (second order) model
The lower-order model latent constructs were transformed into the indicators for the second-order model through SmartPLS (Figure 4). Respective indicators were formatively added to the higher-order constructs. The cross-loadings again confirmed that each formative indicator was strongly associated with the second-order construct, suggesting sufficient discriminant validity. Multicollinearity was not a problem in the inner and outer model (VIF < 3). The model fit of SRMR = 0.043, and the Q2 (value = 0.349) of the Target Behaviour indicates a good model fit with adequate predictive power.
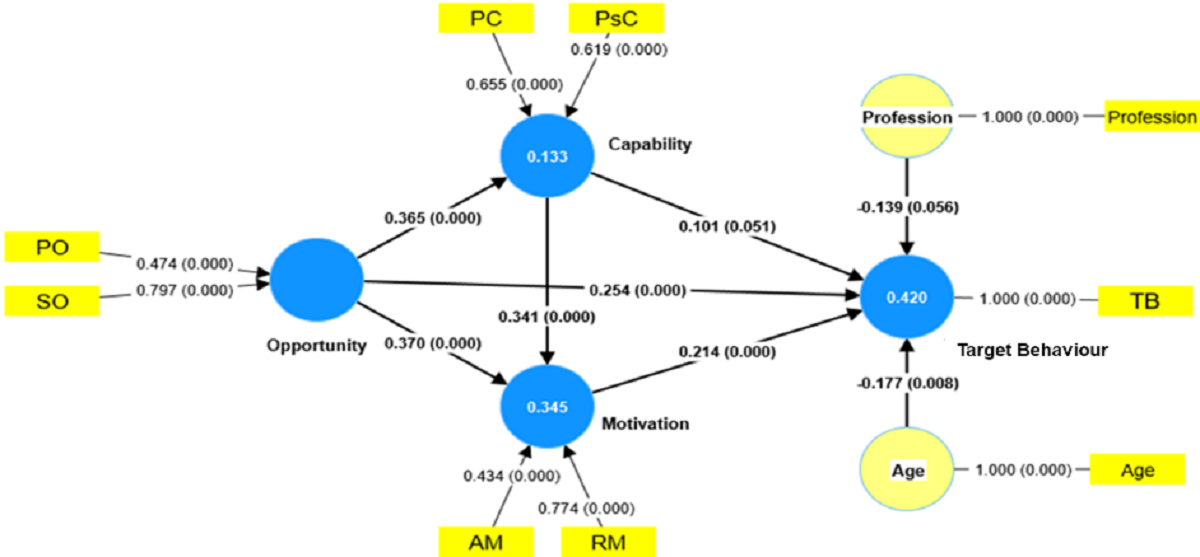
The higher-order model path analysis found the following significant relationships between exogenous and endogenous higher-order constructs, including the influences of age and profession on the Target Behaviour. They were:
-
Opportunity (β = 0.365, p < 0.001) significantly predicted Capability with 13.3% explained variance.
-
Capability (β = 0.341, p < 0.001) and Opportunity (β = 0.370, p < 0.001) significantly predicted Motivation with 34.5% explained variance.
-
Opportunity (β = 0.254, p < 0.001), Motivation (β = 0.214, p < 0.001), and demographic variable Age (β = -0.177, p < 0.01) significantly predicted Target Behaviour with 42% explained variance.
hows the mediation analysis of the higher-order model paths. The analysis found thatCapability fully mediated the Target Behaviour through Motivation (β = 0.073, p < 0.01), as the direct effect of Capability on the Target Behaviour was insignificant (β = 0.101, p > 0.05). Whereas the Opportunity partially mediated the Target Behaviour through Motivation (β = 0.079, p < 0.01) and Capability–Motivation (β = 0.027, p < 0.01). However, the indirect effect of Opportunity on the Target Behaviour through Capability (β = 0.037, p > 0.05) remained insignificant.
|
Path |
Total effect (TE) |
Indirect effect |
Direct effect |
||||
|---|---|---|---|---|---|---|---|
|
β (95% CI) |
p |
mediator |
β (95% CI) |
p |
β (95% CI) |
p |
|
|
Capability → Target Behaviour |
.174 (.073–.275) |
< 0.01 |
Motivation |
.073 (.033–.120) |
< .01 |
.101 (.001–.205) |
> .05 |
|
Capability |
.037 (.001–.080) |
> .05 |
|||||
|
Opportunity → Target Behaviour |
.397 (.289–.501) |
< .001 |
Motivation |
.079 (.038–.128) |
< .01 |
.254 (.133–.373) |
< .001 |
|
Capability-Motivation |
.027 (.012–.047) |
< .01 |
|||||
According to Sarstedt et al. (2021), total effect (TE) is the sum of the direct and indirect effects between an exogenous and an endogenous latent variable in the path model. On the Target Behaviour, Opportunity had the highest total effect (TE = 0.397), followed by Motivation (TE = 0.214) and Capability (TE = 0.174). On Motivation, Opportunity (TE = 0.494) also had a higher total effect than Capability (TE = 0.341).
Hypothesis testing
Based on the results of the lower and higher-order model, the following observations are made on the five hypotheses:
-
Physical capability significantly predicted Motivation (reflective and automatic) and Target Behaviour at 0.05 and 0.01 significance levels, respectively. Psychological capability (p < 0.001) contributed significantly to the reflective motivation but was insignificant to the Target Behaviour. However, overall, the Capability (β = 0.101, p < 0.1) positively contributed to the Target Behaviour. Hence, hypothesis H1 is confirmed.
-
The Opportunity (β = 0.254, p < 0.001) had the highest effect on the Target Behaviour compared to Capability (β = 0.101, p < 0.1) and Motivation (β = 0.214, p < 0.001). Hence, hypothesis H2 is confirmed.
-
Opportunity significantly predicted both Capability and Motivation at a 0.001 significance level. There was no significant relationship between physical opportunity and Capability (physical or psychological); however, social opportunity (p < 0.001) had a significant contribution to physical and psychological capability. Hence, hypothesis H3 is confirmed.
-
Motivation (p < 0.001) significantly predicted the Target Behaviour. Capability had full mediation on the Target Behaviour through Motivation. On the other hand, Opportunity partially mediates the Target Behaviour through Motivation and Capability–Motivation. The model explained Target Behaviour with 13.3% explained variance in Capability and 34.5% explained variance in Motivation. Hence, hypothesis H4 is confirmed.
-
Among the demographic factors (gender, profession, having children, marital status, age), age significantly affected the Target Behaviour at a 0.01 significance level. Hence hypothesis H5 is confirmed.
Discussion
Prediction model
Our research aimed to validate the constructs of the hypothetical COM-B model concerning safe uses of pedestrian crossings. The COM-B model is analysed at a macro and micro level to understand the contribution of each model's variables to the Target Behaviour. In the research model, the Target Behaviour was characterised by three essential compliances of crossing behaviour: not committing a violation (use of a nearby crossing), aggressions, and lapses. The model output showed that Opportunity was the most important driver of the Target Behaviour, followed by Motivation. Opportunity significantly predicted both Capability and Motivation. For the first time, this study looked at the three COM-B components and assessed their ability to predict the Target Behaviour in the road safety domain. The predictive component of the COM-B could be comparable with TPB components. The three components of TPB were found to be significant predictors of pedestrians' road crossing intention, where perceived behavioural control (comparable with the Capability and physical opportunity component of COM-B) emerged as the strongest predictor (Evans & Norman, 1998; Evans & Norman, 2003). However, a study in China showed that instrumental attitude (comparable with the Motivation component of COM-B), as well as conformity tendency & descriptive norms (comparable with the social opportunity component of COM-B), were found significant in predicting pedestrians' violation (Zhou et al., 2016). Those results testify to the strength of each component of COM-B in predicting violation behaviour.
This study also found that the older group of pedestrians (primarily workers in this study) have a negative influence on safe crossing use compared with students of age less than 18. A study in China showed that most school students (generally aged less than 15) demonstrated safe crossing behaviour, especially older children, compared to younger children for the lack of cognitive-perceptual skills to judge traffic risks accurately (Wang et al., 2018). Moreover, students are expected to display more safe crossing behaviour than workers, as many have no formal education. In Serbia, a study shows that young people aged 15–25 commit more violations than older people (Antić et al., 2016). Another study found that higher levels of lapses and aggression violations reported by young adults (18–25 years) in Pakistan (Nordfjærn & Zavareh, 2016).
The dominant two physical (walking; overcoming fatigue or tiredness) and three psychological (controlling mood in assertive crossing; knowledge of traffic rules and users' priority; fines) capability indicators appropriately covered the suggested TDF domains (knowledge; skills; memory, attention and decision process; and behavioural regulations) of Capability. In predicting Motivation and Target Behaviour, the strength to overcome tiredness and controlling mood in assertive crossing played the largest role in physical and psychological capability. Evidence suggests that participants (older population) with reduced physical (and cognitive function) ability make more unsafe crossing decisions (Butler et al., 2016). The research population was mostly young, so they were expected to have enough physical strength to overcome the physical barrier to enact the Target Behaviour. Assertive crossing is quite common where drivers' yielding is rare. Here, controlling mood, in other words, remaining calm and making a decision, is the key to creating a win-win situation with a mutual agreement between the interacting parties involved, supported by the Dual concern model (Pruitt, 1986).
The dominant three physical (traffic signs/marking, visibility, refuge/waiting area) and two social (social support from family/institution, the role model by influential persons) opportunity indicators sufficiently covered the suggested TDF domains (environmental restructuring and resources; social influences) of Opportunity. In predicting Motivation and Target Behaviour, visibility to drivers and support from family or institution played the most prominent role in physical and social opportunity. Poor visibility of people and vehicles is a severe issue in LMICs. For example, 40% of pedestrian fatalities occurred due to poor vehicle visibility in South Africa (Ribbens, 2003), as speed is the primary threat to pedestrians, especially when the vehicles come to a distance less than required for braking. Previous studies show that social support from family and friends helps to reduce the likelihood of young pedestrians breaking the law (Xiao et al., 2021) and enhance activity levels (Mendonça et al., 2014). In our case, students or workers could listen to their family members' advice to use crossings, especially footbridges, to exercise more and achieve physical fitness. Institutional or family support also contributes to safety awareness and decision-making.
The dominant five reflective (planning, safety priority, persuasion, praise, imitation) and two automatic (habits; guilty or good feelings) motivation indicators well covered the suggested TDF domains (social/professional role and identity; beliefs about capabilities; optimism; beliefs about consequences; reinforcement; intentions; goals; emotions) of Motivation. In predicting Target Behaviour, safety priority and habit played the most considerable role in reflective and automatic motivation. Past consequences often influence future behaviour, especially when it comes to safety (Kouabenan, 2009). As the students and workers are more victimised in Bangladesh, they have ample examples of believing the consequences of undermining safety rules. Road crossing habit is one of the critical determinants of road traffic injuries (Tiwari et al., 2021), especially for the children's safety in LMICs.
In terms of model explanatory power, R2 should be ≥ 0.10 to be deemed adequate (Falk & Miller, 1992). In contrast, others suggest 0.26 as substantial (Cohen et al., 2014). The R2 value of Target Behaviour (42%) and Motivation (34.5%) confirms substantial in-sample explanatory power. The Q2 value also confirms the models' out-of-sample predictive power, which means that the model could forecast the Target Behaviour and Motivation using other samples beyond the sample used in this study. This explanatory power can be compared with behavioural models like TPB. A study in the UK sought to identify key attitudinal and motivational factors in pedestrians' road crossing decisions, where TPB explained between 37% to 47% of the variance in different hazardous scenarios (Evans & Norman, 1998).
Factors in motivation to safe crossing use
The concept of safe crossing use or Target Behaviour encompasses three components: avoiding violations in the use of nearby crossings, avoiding aggression, and avoiding road safety lapses. Those target behavioural components could be described with descriptive statistics, as shown in Table 1 in section 5.2, with some comparison with the previous results. This study found that the participants reported a relatively high mean score, indicating positive or favourable behaviours related to using nearby crossings. In contrast, the highest mean score of other violation behaviours suggests violation behaviours remain predominant among other behaviours. The mean score for lapses was moderate, suggesting that, on average, participants reported moderate lapses in their behaviours. However, participants reported a lower mean score, indicating that, on average, aggression-related behaviours were less frequent. These results align with another study in Bangladesh, where a study on pedestrians' self-reported behaviour showed that the mean score of violations, aggression, and lapses measured on a 6-point scale were more than 3, around 1.5, and about 2, respectively (Mcilroy et al., 2019).
The prediction model considers both automatic motivation and reflective motivation factors. Regression results indicated that satisfaction with crossing use, thinking as a benefit from avoiding risky crossings, and habit formation directly and significantly impacted pedestrians' violations, aggressions, and lapses, respectively.
Satisfaction with crossing use can help in reducing pedestrians' violation behaviour in crossing use by promoting a positive and enjoyable experience. When pedestrians feel satisfied with their crossing experience, it indicates that their needs and expectations have been met, and they perceive the crossing as safe and convenient. This positive perception of the crossing environment can lead to higher compliance with crossing rules and regulations. A study discovered a significant correlation between pedestrian satisfaction and environmental factors, particularly low-cost and feasible micro-scale interventions such as ‘path quality’ (Kim et al., 2014). Path quality refers to the design and upkeep of pathways and walkways to prioritise pedestrian safety, comfort, and usability. Additionally, pedestrian satisfaction plays a role in promoting walking behaviour (Ettema et al., 2011). Satisfied pedestrians are more likely to follow traffic signals, use designated crosswalks, and wait for appropriate gaps in traffic before crossing.
Promoting a rational and cautious approach to road interactions can help reduce pedestrians' aggression towards drivers. In Bangladesh, drivers are legally obligated to yield the right of way to pedestrians at designated crossings. However, it is common for drivers to violate this rule without facing any legal consequences. Consequently, pedestrians have become accustomed to this situation, and instances of pedestrians expressing aggression towards drivers who disregard their rights are rare. In such circumstances, emphasising the benefits of making safe choices, such as avoiding crashes, injuries, or conflicts with drivers, could influence pedestrians' mindsets and encourage them to adopt a more cooperative and considerate attitude towards drivers. This shift in thinking can reduce aggressive behaviours as pedestrians become more aware of the mutual responsibility for road safety and the importance of respectful interactions with drivers. Previous studies have shown that attitudes towards pedestrian safety significantly predict pedestrian risk-taking behaviour (Nordfjærn & Zavareh, 2016).
Satisfactory walking experiences are more likely to be chosen again and can become habitual behaviours (Asakura et al., 2022). Past behaviour frequency is a reliable indicator of habit (Triandis, 1977). Habits can occur automatically without conscious effort, significantly impacting behaviour (Bargh et al., 1994). Even when motivation changes, habits tend to persist (Webb & Sheeran, 2006). A study in India on school students aged 12–15 showed that nurturing good street-crossing habits increased children's safety (Tiwari et al., 2021). As these habits become ingrained, they help reduce lapses in road safety and foster a culture of responsible pedestrian behaviour.
Further elaboration on the contribution of Capability and Opportunity factors in predicting Motivation for the Target Behaviour can be supplemented by presenting the direct impact of construct on the behavioural components of safe crossing use separately:
Physical capability factors
The ability to walk is crucial factor revealed in regression analysis in avoiding violations. Those with difficulty walking or mobility impairments may face challenges in crossing the road, which can increase the likelihood of violating crossing rules or encountering difficulties during the crossing process. Physical strength also plays a role in safe crossing behaviour. Crossing the road often requires individuals to move quickly, especially in situations with fast-moving traffic. Having adequate physical strength allows individuals to cross the road efficiently, reducing the chances of interaction with drivers, which could instigate a situation to provoke pedestrians' aggression towards drivers. Physical strength can also influence perceptions of safety. Pedestrians who feel physically stronger may perceive themselves as better equipped to navigate traffic and make quick decisions, leading them to choose crossing options that prioritise convenience or saving time rather than solely focusing on safety. Guo et al. (2014) observed that a relatively smaller percentage (17.32%) of participants considered physical strength as a crossing principle compared to safety (50.49%) and convenience (32.17%), where most participants (86.13%) are willing to accept the detour distance within 100 meters. Study suggests that some pedestrians consider their physical capabilities when making crossing choices, especially crossing on multilane roads (Dommes et al., 2014), or detours for using crossings. Research on the determinants of safe crossing for older adult pedestrians highlights several factors contributing to their heightened vulnerability in road environments. These factors include physical and cognitive impairments, such as reduced walking speed, strength, hearing, and vision (Lord et al., 2018).
Psychological capability factors
Psychological precursors of pedestrian behaviours have received limited attention in LMIC research studies (Nordfjærn & Zavareh, 2016). However, it could be rational to consider that individuals with better mood control and assertiveness while navigating road crossings are more likely to avoid negative behaviours. Interestingly, there is a possibility that an angry pedestrian may exhibit more assertive behaviour when crossing the road (Camara et al., 2020). The anger might influence pedestrians to take a more assertive approach, potentially disregarding traffic rules or safety considerations. In a study conducted with a Chinese population, higher levels of altruism, indicating a more significant concern for others, were associated with more positive behaviours and fewer lapses in pedestrian behaviour. Conversely, the study also revealed a link between anger and more aggressive behaviours. Additionally, neuroticism was found to be a significant predictor of transgressions and lapses in pedestrian behaviour (Zheng et al., 2017). High neuroticism levels can indicate a greater inclination to experience negative emotions and difficulties in coping with problems (Jovanovic et al., 2011).
In pedestrian behaviour research, it has been observed that active attention and engagement in cognitive processes before crossing the road have significant implications. Regression results suggest that paying attention or thinking before crossing significantly impacted avoiding violations in using nearby crossings and lapses. Pedestrians who are attentive and make conscious assessments of the traffic situation are better equipped to identify potential risks and make informed decisions regarding when and how to cross. Studies have shown that changes in head orientation, such as looking or glancing at the traffic, strongly indicate crossing intention (Rasouli et al., 2017). Furthermore, it has been found that violations and lapses in attention or judgment have a negative impact on crossing time (Deb et al., 2018). Pedestrians who engage in behaviours that violate traffic rules or experience lapses in attention tend to take longer to cross the road. By actively following traffic regulations, such as waiting for a green signal at designated crossings and yielding to oncoming traffic when necessary, pedestrians can avoid risky behaviours that may result in violations. It is important to note that other psychological factors, such as knowledge of traffic rules and the potential fines for violations, also contribute to the cognitive process. These factors provide pedestrians with the correct information and further support them in making informed decisions and engaging in safe crossing behaviours.
Physical opportunity factors
This study found that physical opportunity influences safe crossing use, particularly impacting violations in using crossings and aggression. Physical opportunity factors, such as better visibility of drivers, shorter crossing time, easy access and usability in all weather conditions, presence of traffic signs and road markings, availability of waiting areas, and pedestrian fences, contribute to safer crossing behaviours. These factors guide pedestrians, enhance safety, and provide designated spaces for safe and comfortable crossings. A study found that restricted visibility significantly threatens pedestrian safety (Mukherjee & Mitra, 2020). Inaccessible pedestrian crosswalks have a negative impact on pedestrian crossing use (Mukherjee & Mitra, 2020). This study found that the short crossing time had a positive correlation with avoiding violation in crossing use but a negative correlation with aggressive behaviour. This result agrees that engaging in violations can increase the time it takes pedestrians to cross road (Deb et al., 2018). When pedestrians take more time to cross, there is a decreased tendency for them to be aggressive towards drivers. Taking more time to cross suggests that pedestrians prioritise their safety and actively assess the traffic conditions before proceeding. This mindset of prioritising safety and being aware of their surroundings tends to reduce frustration and impatience, which are often triggers for aggressive behaviours.
Stapleton et al. (2017) found that yielding compliance improved significantly when crosswalk markings were available. Another study found that pedestrians with higher pedestrian-related traffic sign comprehension were less likely to engage in transgressions, lapses, and aggressive behaviours (Tekeş et al., 2021), while being more likely to exhibit positive behaviours. Traffic signs not only remind pedestrians of crossing rules to the pedestrians but also inform drivers in advance of a crossing location. The availability of waiting areas in the middle or at the side of the road also helps pedestrians for safe and comfortable crossings (Zhang et al., 2017). Pedestrians generally do not prefer grade-separated facilities, especially women and older pedestrians (Anciaes & Jones, 2018). Fencing helps direct pedestrians towards formal crossing points and discourages dangerous crossing movements in unauthorised road segments where drivers do not expect them. A study on garment workers in Dhaka city of Bangladesh, showed that such facilities should match the desired travel path and be supplemented with median barriers and footpath fencing to make them self-enforcing (Hoque et al., 2006). Study shows that the strategic placement of crosswalks concerning nearby land use, considering areas that generate or attract pedestrian traffic, can greatly enhance pedestrian compliance rates (Sisiopiku & Akin, 2003).
Social opportunity factors
This study found that social opportunity influences safe crossing use, predominantly impacting aggressions and lapses. Social opportunity factors, including the presence and influence of influential people, education and support from family/institutions, parental safety alert reminders, and the presence of many users in crossing or group crossings, positively impact safe crossing practices. Study found that when parents or teachers accompany students, they tend to behave more correctly in traffic (Holm et al., 2018). Similarly, when families and institutions provide education and support regarding crossing safety, individuals are more likely to engage in responsible behaviours and help to avoid aggression and lapses. Parental reminders regarding safety serve as a proactive measure to enhance awareness and caution during crossings, reducing the likelihood of violations, aggression, and lapses. Regression results suggest the education and support from family/institution and the parental safety alert reminders from time to time significantly impacted avoiding aggressive behaviour and road safety lapses, respectively. This highlights individuals' social influence and collective behaviour during crossings, which can contribute to a safer and more coordinated crossing experience. Previous research conducted in China (Zhou et al., 2009), found that pedestrians were more likely to cross the road when they observed other pedestrians crossing. Similarly, Koh et al. (2014) discovered that individuals were more likely to violate traffic rules when they were alone compared to when they were accompanied by companions, particularly on wide 4-lane roads with medians.
Fostering motivation and optimising benefit in intervention design
Designers in LMICs need to balance actual demand and available resources to create cost-effective solutions that motivate pedestrians. For instance, a simple, low-cost safety message reflecting parental expectations may be more motivating than investing in costly infrastructure like road barriers. While simple messages can be effective in promoting safety, improving infrastructure remains an important long-term goal for pedestrian safety. Therefore, it is the responsibility of the designer who needs to play a vital role in choosing appropriate interventions suited for the context.
Designers should target reflective and automatic motivation factors to encourage safe crossing use. Reflective motivation strategies can include safety priority campaigns, education programs, and awareness about fines for violations. Automatic motivation strategies can involve creating positive emotions related to crossing use, emphasising the benefits of avoiding risky crossings, and facilitating convenient and efficient crossing experiences. Designers should prioritise satisfaction, thinking benefits, and habit formation to promote safe crossing use. Enhancing pedestrians' satisfaction with the crossing experience helps meet their needs and expectations, increasing compliance with crossing rules. Emphasising the benefits of avoiding risky crossings encourages informed decisions, reducing impulsive and risky behaviour. Fostering habit formation establishes positive and automatic crossing behaviours, ensuring consistent safety. By emphasising these factors, designers can create safer and more effective crossing environments.
The prediction model results indicate that Opportunity contributes the most to safe crossing use compared to Capability and Motivation. Motivation is a key mediator for Capability and Opportunity in predicting safe crossing use. Physical opportunity influences safe crossing use through automatic motivation, particularly impacting violations in using crossings and aggression. Social opportunity influences safe crossing use through reflective and automatic motivation, predominantly impacting aggressions and lapses. Additionally, social opportunity significantly influences pedestrians' physical and psychological capabilities. Targeting psychological capability influences target behaviour, especially lapses, through reflective motivation. These model findings can be helpful to designers in several ways.
Designers can maximise benefits when enhancing pedestrians' physical opportunities by prioritising physical opportunity factors that foster automatic motivation. This can be achieved through visually appealing and inviting pedestrian environments, improved accessibility for all pedestrians, and clear and visible pedestrian crossings. Signage and fencing can guide pedestrians towards designated crossing points and discourage risky behaviour. Creating convenient and efficient crossing experiences involves implementing pedestrian-friendly infrastructure and incorporating refuge areas or pedestrian islands.
To improve pedestrian safety, designers should consider strategies that promote the utilisation of existing footbridges in LMICs. Research suggests that women have lower probabilities of choosing footbridges and underpasses compared to men (Anciaes & Jones, 2018). Therefore, motivating vulnerable road users such as women, elderly or disabled people, installing escalators or elevators can make footbridges more accessible, implementing fences or barriers with surveillance cameras and lighting for increased safety and security, and conveying safety messages through posters to promote footbridge use.
When creating social opportunities, designers can involve influential individuals, collaborate with families and institutions, facilitate group crossings, and implement safety alert reminders to impact motivation factors for safe crossing practices positively. For example, a local celebrity endorsing safe crossing practices can create a positive social norm. Collaborating with schools and workplaces can enhance social opportunity through education programs and policies. Facilitating group crossings provides a sense of community and safety. Safety alert reminders in the built environment reinforce safe crossing behaviours.
In addition to motivation factors, social opportunity can be effectively utilised to maximise its impact on safe crossing use, especially in contexts where lapse type of behaviours is predominant, by leveraging its influence on pedestrians' psychological capabilities targeting reflective motivations. Designers can implement safety education programs, incorporate visual cues and reminders, create environments that regulate moods and emotions, and leverage social influence through normative messaging to enhance psychological capabilities.
Conclusions and implications
his study conceptualises a COM-B model using the theoretical domains framework (TDF) and analyses it at lower- and higher-order levels. The key features include:
-
The conceptual model substantially explains pedestrians' safe use of crossings and their motivation.
-
Opportunity is the most important predictor, and Motivation is the most potent mediator in the research model.
-
Physical opportunity has the most significant influence on avoiding violations in using nearby crossings, while social opportunity has the most significant influence on avoiding aggressions and lapses.
The study aims to predict safe crossing use by addressing its three essential behavioural components (e.g. avoiding—violations in using nearby crossings, aggressions, and lapses) in Bangladesh. The findings underscore the complex interplay among Capability, Opportunity, and Motivation factors in shaping safe crossing behaviours, highlighting the necessity of comprehensive interventions and strategies to enhance pedestrian safety. By utilizing the study results, designers can develop interventions that optimise benefits while working within limited resources. The study suggests that designers should target both reflective and automatic motivation factors to encourage safe crossing use. Additionally, these motivation factors have varying impacts on different behavioural components. Designers should prioritise satisfaction with crossing use to address violations in using crossings, emphasise the benefits of avoiding risky crossings to prevent aggressions, and focus on habit formation to mitigate lapses.
To improve pedestrian safety, the study recommends the following interventions that target pedestrian motivations and have the potential for long-term benefits:
-
Designing pedestrian-friendly infrastructure: Designers should prioritise safe crossing behaviours by creating visually appealing and inviting pedestrian environments, improving accessibility for all pedestrians, emphasising the benefits of avoiding risky crossings through signage and strategic placement of traffic signs and fencing, and implementing pedestrian-friendly infrastructure such as clear crossings, road markings, and refuge areas. Designers can create footbridges that foster positive emotions related to crossing use, emphasise the advantages of avoiding risky crossings, and provide a convenient and efficient crossing experience.
-
Enhancing pedestrian capabilities: Considering the influence of physical capability factors, designers should prioritise measures that support pedestrians with varying physical abilities. Providing well-maintained walking surfaces, appropriate crossing distances, and accessible infrastructure can facilitate safe crossing behaviours for individuals with different mobility levels. Designers should also consider the importance of physical strength in enabling efficient and confident crossing, especially in situations with fast-moving traffic.
-
Promoting psychological capabilities: Designers should consider strategies to enhance pedestrians' psychological capabilities related to safe crossing. This can be achieved through educational campaigns that increase knowledge of traffic rules and regulations, including visual cues, such as signage and signals, that remind pedestrians to stay focused and cautious during the crossing. Information about the consequences of violations, such as fines, can create awareness and encourage pedestrians to think before crossing. Mood control techniques, such as incorporating calming elements or green spaces in crossing areas, can help pedestrians make proactive and safe crossing decisions. By addressing psychological capabilities, designers can support pedestrians in making informed and cautious crossing choices.
-
Creating social opportunities: Designers should create social opportunities that encourage safe crossing behaviours. This can be achieved by involving influential individuals, such as community leaders or role models, such as school teachers or garment industry managers, in promoting safe crossing practices. Collaborating with families, schools, and institutions to provide education and support related to pedestrian safety can also positively impact. Designers can also consider strategies to facilitate group crossings, such as sensor-based crossing signals or overhead flashing beacons for drivers' attention and dedicated crossing times for the students and workers at their peak time. Moreover, designers can collaborate with parents and caregivers to implement safety alert reminders, such as signage or smartphone apps, to enhance awareness and caution during crossings.
The research limitation is the small sample size, and the survey population excludes older people and children below ten years. Other factors that could affect the results include COVID situation-related stress, forgetting the pre-COVID behaviour and attitude, and the influences of teachers or institutional managers. Respondents are expected to remember their pre-COVID behaviour as they are familiar with the research sites near their institutions. The research team briefed the research objectives and ethical issues to the representative teachers or the industry managers before distributing questionnaires to the respondents, which minimises their influence on the respondents.
The study reveals significant differences in aggression and road safety lapses between at-grade and grade-separated crossings due to inherent design variations. At-grade crossings pose a higher risk of conflicts and aggression, while grade-separated crossings offer physical separation, reducing aggressive behaviours. However, no significant difference was found in violations between the two groups, possibly due to respondents' inability to differentiate crossing types. Age and profession negatively influenced crossing behaviour, emphasising the need for tailored approaches. Further research is needed to understand contributing factors and the effectiveness of interventions. In LMICs, institutional weaknesses and lack of user involvement hinder safety interventions. Prioritising safety, designers can implement traffic calming strategies and advocate for stricter enforcement. The absence of certain facilities could affect study results, but a co-design approach can uncover innovative solutions. Collaborative design processes address pedestrian needs and lead to effective safety interventions.
A designer could use the TDF-supported questionnaire to understand the behaviour of interest in the road safety domain, which ultimately helps to identify intervention options and associated road safety behavioural change techniques (Fylan, 2017). A study in healthcare shows that the combined use of co-design and behaviour change constitutes a promising strategy in formulating a shared vision of challenges and thus helps to find potential solution routes with quality outcomes (Carvalho et al., 2017). Co-design does not contradict but adds to the Safe System principles and helps to apply its principles in LMICs.
Declaration of competing interests
The authors declare that they have no known competing financial interests or personal relationships that could have appeared to influence the work reported in this paper.
Ethics statement
This study received ethical approval from the University Research Ethics Committee (Ref: AREA 20-103).
Funding
This work received funding from the Bangabandhu Science and Technology Fellowship Trust Authority of Bangladesh.
CRediT contribution statement
M. Shaheen Sarker: Conceptualisation, Formal analysis, Investigation, Methodology, Writing—original draft, Writing—review & editing.
Oliver Carsten: Conceptualisation, Methodology, Supervision, Writing—review & editing.
Yue Huang: Conceptualisation, Methodology, Supervision, Writing—review & editing.
Foroogh Hajiseyedjavadi: Conceptualisation, Methodology, Supervision, Writing—review & editing.