Traffic Safe Municipality : a Norwegian approval scheme to facilitate develop ment of a municipal traffic safety culture
Handling editor: Aliaksei Laureshyn, Lund University, Sweden
Reviewers: Matts-Åke Belin, World Health Organization, Switzerland
Tania Dukic Willstrand, DuWill AB, Sweden
Received: 12 December 2022; Accepted: 28 March 2023; Published: 11 April 2023
Abstract
This study examines the consequences of being approved as a Traffic Safe Municipality for municipal traffic safety culture, based on surveys (n = 2255) and interviews (n = 17) in 24 municipalities. Traffic Safe Municipality is an approval scheme for Norwegian municipalities, which defines criteria for systematic traffic safety work. Development of a positive municipal traffic safety culture is an explicit aim of the approval scheme. The respondents in the survey state positive consequences for the traffic safety culture in their own workplace after being approved as a Traffic Safe Municipality. The self-reported focus on traffic safety has increased among immediate managers and among colleagues, and it has become easier to address issues related to traffic safety in one's own workplace. In multivariate statistical analyses, we see that these changes are also linked to the respondents stating that they think more about traffic safety in their everyday work and they state that they behave safer in traffic during working hours. The study has also mapped factors that promote or impede implementation of Traffic Safe Municipality. Lack of resources in the municipality, time pressure, high workload and replacement of personnel may hamper implementation, while top managers' involvement throughout the implementation period is one of the most important prerequisites for successful implementation. We conclude that Traffic Safe Municipality can be interpreted as a measure to establish a traffic safety culture through the implementation of a safety management system in the municipality. Such systems are required as a measure to create a positive safety culture in a number of different high-risk sectors (aviation, nuclear power, oil, and gas). Our study is unique, since we apply this perspective in the municipal sector.
Keywords
Safety Management System, Traffic Safe Municipality, Traffic Safety Culture
Introduction
Background
Approximately 1.3 million people are killed annually as a result of road traffic crashes, and between 20 and 50 million people suffer non-fatal injuries, with many incurring a disability as a result of their injury (WHO, 2022). The numbers of people killed or severely injured in road crashes have gradually been reduced in recent years as a result of traditional safety strategies focusing on safety behaviors, technology, and infrastructure (Elvik et al., 2009). It has been argued that additional reductions are contingent on developing new approaches to prevention, for example the traffic safety culture approach (Edwards et al., 2014; Ward et al., 2010). Nævestad and Bjørnskau (2012) argue in favour of applying the traffic safety culture approach to the municipal level, but they conclude that this line of thought is poorly developed. In this study, we provide a way of applying the traffic safety culture concept to the municipal level.
The present paper focuses on Traffic Safe Municipality, which is a Norwegian approval scheme for systematic traffic safety work in municipalities. The background of this approval scheme is the recognition that Norwegian municipalities can influence traffic safety in a number of different ways. First, municipalities have a direct influence on traffic safety, through their employees who drive, cycle or walk etc. in their work. Norwegian municipalities are a significant employer, with over 500 000 people employed in total. We may assume that many of the municipal employees drive, cycle, walk etc. regularly at work, and that a certain proportion of them are involved in traffic accidents each year. Traveling in traffic is often the biggest risk you are exposed to during a normal working day. A total of 36% of fatal road accidents in Norway involve at least one driver who has been driving for work (Nævestad et al., 2015). An earlier study found that approximately 1 500 people are injured annually on Norwegian roads in work-related traffic accidents (Nævestad et al., 2015) 1 .
In addition, the municipalities have an indirect influence on traffic safety in a number of areas, including through their role as road owner, which includes tasks related to road design, lighting and speed limits on municipal roads. The municipality also influences traffic safety as a transport buyer, through establishing safety requirements to actors that they buy transport services from, for example safety equipment, safety routines, etc. Within adolescence and school, the municipalities also have a large indirect influence on traffic safety through information and training, aimed at parents and schoolchildren, which child health clinic, kindergartens and schools provide.
Previous studies show that measures aimed at safety culture and safety management can lead to a significant decrease in traffic accidents in organizations that employ drivers (Nævestad et al., 2018). Safety culture refers to shared and safety-relevant ways of thinking or acting that are (re)created through joint negotiation by people in social settings (Nævestad, 2010). The few robust studies that exist of this indicate that safety culture and safety management measures can reduce the incidence of traffic accidents by between 20% (Wouters & Bos, 2000) and 60% (Gregersen et al., 1996; Nævestad et al., 2018). There is reason to believe that these conclusions also apply to municipal agencies.
However, previous research indicates that organizations with employees who drive at work seem to have little focus on the importance of safety culture and safety management (Nævestad et al., 2015). It has been pointed out that this applies to both transport companies, public agencies and other organizations that have employees who drive in their work. In 2015, The Norwegian Road Safety Coincil (Trygg Trafikk) launched the concept ‘Traffic Safe Municipality’. This is an approval scheme that defines criteria for systematic traffic safety work, which the municipality's agencies must fulfil, for the municipality to be approved. As of December 2022, there were approximately 151 municipalities that had been approved as Traffic Safe Municipalities out of a total of about 350 municipalities in Norway. The first was approved in August 2015, and the approved municipalities are scheduled to be re-approved after three years. The re-approval involves a new evaluation of whether criteria are fulfilled and further measures aiming to improve the traffic safety work.
In a previous study, we concluded that Traffic Safe Municipality, and the work with traffic safety plans which are a fundamental part of this, can be defined as a measure to establish traffic safety culture through the implementation of a safety management system (SMS) in the municipality (Nævestad et al., 2017; Nævestad et al., 2017). There are two reasons for this. First, as Traffic Safe Municipality focuses on defining roles, responsibilities and procedures for traffic safety in the municipality (Thomas, 2012). Second, as it has a traffic safety plan as a key element, in line with the continuous improvement, which is fundamental in the SMS approach. In addition, safety culture change is one of the main goals of Traffic Safe Municipality.
SMS relates to the formal aspects of safety in organizations (‘how things should be done’). SMS usually consists of formal routines and measures that enable the organization to work systematically with safety, for example by establishing formal safety policies and objectives, establishing important roles and responsibilities, systematically gathering information about incidents and hazards, developing countermeasures, monitoring their effect, and adjusting measures if necessary (Thomas, 2012). The principles in SMS are often in line with a continuous improvement approach and process: ‘Plan, Do, Check, Adjust’. Furthermore, the SMS defines the company's responsibility to prevent work-related accidents through the implementation of such formal measures. The informal aspects of safety management generally refer to safety culture (‘how things are actually done’), i.e. shared and safety-relevant ways of thinking or acting (Nævestad, 2010). The research into safety management and safety culture often shows that it does not help with extensive formal systems for safety, if the employees in practice do something other than what the systems say they should do.
The development of a positive safety culture is a formal goal and rationale for SMS in the maritime sector (IMO, n/d), in aviation (ICAO, 2016), in rail (ERA, n/d), and also in the voluntary ISO:39001 standard in the road sector (ISO, 2012). Thus, it is assumed that the development of formal procedures (‘how things should be done’) will influence informal practice (‘how things are actually done’) (Nævestad et al., 2018). Studies also indicate positive effects of SMS on safety culture in aviation (Adjekum & Tous, 2020), in the maritime sector (Lappalainen et al., 2012) and in railways (Zuschlag et al., 2016). Thus, although there are relatively few systematic studies in this area, research suggests that the implementation of SMS can lead to increased traffic safety.
In order for a Traffic Safe Municipality to be as effective a traffic safety measure as possible, we need more knowledge about relationships between Traffic Safe Municipality and safety outcomes (traffic safety culture, traffic safety behaviour, etc.)
Study aims
The study has four aims:
-
Examine whether implementation of the criteria for Traffic Safe Municipality is related to perceptions of safety culture improvements among respondents in the approved municipalities
-
Examine whether potential changes in safety culture are related to respondents' self-reported increased focus on traffic safety in their work activities
-
Examine whether potential changes in safety culture are related to self-reported improvements in respondents' traffic safety behaviours
-
Map factors that promote or inhibit implementation of Traffic Safe Municipality.
Hypotheses based on previous research
We have developed the following hypotheses based on the previous research (cf. section 1.5):
-
Implementation of the criteria for Traffic Safe Municipality has led to perceptions of safety culture improvement in the approved municipalities.
-
Perceptions of traffic safety culture improvements are related to respondents' self-reported increased focus on traffic safety in their work.
-
Perceptions of traffic safety culture improvements are related to self-reported traffic safety behaviour improvements among the respondents.
-
Managers' and employees' commitment has been decisive for good implementation.
What is a Traffic Safe Municipality?
The background of Traffic Safe Municipality is that previous municipal traffic safety plans generally focused on physical measures (e.g. walkways, cycleways, speed bumps, signage, design of intersections) to improve traffic safety. However, the physical aspect, which is typically included in traffic safety plans, comprises only a limited part of the total work on traffic safety in a municipality. Much of the important traffic safety work is given at child health clinics, in kindergartens, and at schools. Information and training are important parts of the traffic safety work that is carried out.
One of the main principles of the Traffic Safe Municipality approval scheme is that traffic safety is naturally integrated in all the municipality's sectors and that every employee has a contribution to the municipal and national traffic safety work. The municipality is a large workplace, and around 10% of the municipality's residents are employed by the municipality. Around 16%–18% of the working population is employed by the municipality.
Traffic Safe Municipality is an approval scheme that is based on laws and regulations that the municipality already is required to follow. There isthus no additional costs associated with the approval. The aim of the approval is to create cross-sectorial work on traffic safety. In order to be approved as a Traffic Safe Municipality, there are certain criteria that must be met. The criteria are based on routines and systems in the respective sector. The municipality must anchor responsibility for traffic safety work with the mayor and municipal director, while partial responsibility may lie with the individual head of department. Upon approval and regulatory approval, the municipal director must document in writing that:
-
The municipality has a traffic safety plan. The plan involves continuous reporting, assessments and adjustments. The plan covers both themes related to road users and physical measures.
-
The municipality has guidelines for employee travel in traffic (on duty)
-
The municipality has procedures for the purchase of transport services
-
The municipality has a committee responsible for traffic safety.
-
The municipality has incorporated traffic safety into the HSE/internal control system, which contains rules for travel and transport under the authority of the municipality, and when purchasing transport services.
-
Traffic safety is an annual topic in the municipality's working environment committee.
-
The municipality has updated an overview of traffic accidents and traffic incidents (property damage) in the municipality.
-
Traffic safety is part of the municipality's public health work.
-
The municipality has a good system for processing applications for transport due to particularly dangerous school roads.
-
The municipality has fulfilled the criteria for each individual sector. (kindergartens, schools, technical department, planning department, cultural department, municipal doctor, child health clinic).
There are also additional criteria for each sector in the municipality, e.g. kindergarten, school, technical department, health.
Previous research
As indicated above, research suggests that the implementation of SMS can lead to increased traffic safety. An extensive literature review indicates that SMS implementation is related to positive safety outcomes (Thomas, 2012). Based on previous research, we can assume that the relationship between SMS and culture is explained by SMS leading to new (common) ways of acting in the organization (Reason, 1997). In addition, it is an explicit aim of many SMS interventions that the new ways of acting that are introduced (for example routines for reporting, risk analyses) should lead to new (common) ways of thinking, or new ways of understanding hazards in the work on (Phillips et al., 2018). These new ways of understanding hazards at work will motivate and reinforce the new ways of acting (Nævestad & Milch, 2021). Finally, the relationship between SMS and safety culture can be explained by employees experiencing an increased management focus on safety in the organisation, which makes it easier to address safety topics and prioritize safety in work (Nævestad, 2010; Schein, 2004). In line with these assumptions, several studies from different transport sectors find relationships between the implementation of SMS, or SMS elements, and positive safety culture in aviation (Hudson, 2003; Patankar, 2019), in railways (Zuschlag et al., 2016), in the maritime sector (Lappalainen et al., 2012) and in the road sector (Naveh & Katz-Navon, 2015).
Several of the above mentioned studies also find that improvements in safety culture also lead to improvements in safety behaviours (and subsequently reductions in accidents and safety incidents) (Naveh & Katz-Navon, 2015; Zuschlag et al., 2016).Naveh and Katz-Navon (2015) find an average reduction of 75% in traffic safety violations in the intervention units where safety climate was improved, while the control units had an increase in violations. The study of Zuschlag et al. (2016) from the railways finds similar relationships: improved safety culture, 80% reduction in risk-taking behavior and 81% reduction in accidents. The study has both before and after measurements and test and control groups.
In contrast to the assumed relationship between SMS and safety culture described above, several studies report discrepancies between formal and informal safety aspects in organizations (Antonsen, 2009; Bye & Aalberg, 2020; Størkersen et al., 2020). This suggests that it is not always the case that a positive safety culture automatically follows from SMS implementation. Several investigations of accidents often point to a gap between formal and informal aspects of safety culture, and that the organization 'did something different in practice than what was said in formal documents and procedures' (Nævestad, 2010). For example, this can be related to systems that are poorly adapted to the work the employees have to do, or to the organization in which they are implemented (Bye & Aalberg, 2020; Størkersen et al., 2020), it may also be related to workload and stress (Bye & Aalberg, 2020; Størkersen et al., 2020), and lacking senior managers' commitment (Edkins, 1998; Lappalainen et al., 2012; Thomas, 2012; Zuschlag et al., 2016). The mentioned studies also point to lacking employee motivation and support, as well as mistrust between managers and employees. Finally, support from a third party is also mentioned as an influencing factor by Zuschlag et al. (2016).
Method
Interviews
We have conducted in-depth interviews with 17 key people in 16 municipalities. The purpose of the interviews was to identify factors that promote or hinder implementation of the Traffic Safe Municipality initiative, to discuss experiences with implementation and the consequences of being approved as a Traffic Safe Municipality. In-depth interviews are particularly suitable when there is little previous research, and there is a need for in-depth knowledge of a topic (Brinkmann & Kvale, 2014).
The qualitative interviews were conducted in the summer and autumn of 2021. The majority of the interviews were conducted digitally via the Microsoft Teams platform. Three of the interviews were conducted over telephone. The interviewees received a request for participation via e-mail. Informed consent was obtained prior to the interviews. A semi-structured interview guide was used, which means that the interview is structured around some predefined themes. The guide is indicative in the sense that both the questions and the order of the questions are adapted to the interview situation, so that it is possible to follow up on new information or topics that emerge along the way. The interview guide contains questions about the process of introducing Traffic Safe Municipality, which people and roles have been particularly involved in the work, the traffic safety plan and other ways in which Traffic Safe Municipality is formalized in the municipality's activities. In addition, the guide contains questions about factors that have promoted or hindered the introduction of the measure.
The interviewees
The interviewees are employees who have had, or have coordination responsibility for Traffic Safe Municipality in their municipality. Besides municipality A, where we interviewed two key people, we have spoken to one key person from most of the municipalities. Traffic safety is an interdisciplinary area that covers a wide range of sectors. There is thus great variation among the municipalities when it comes to where responsibility for the coordination of Traffic Safe Municipality is formally placed. In most municipalities, the responsibility is placed under a technical agency, which is often responsible for planning and implementing physical traffic safety measures, such as road improvement, development of cycle paths, lighting, etc. Measures focusing on road users and attitudes, on the other hand, fall under public health. In many municipalities, the responsibility for Traffic Safe Municipality is placed with the municipality's public health coordinator, who often works within health or education. In some of the municipalities, the responsibility for Traffic Safe Municipality was placed in other agencies. Among the people we interviewed, 8 were employed in a technical agency, 4 people were employed as public health coordinators, 4 in education, and one from another agency.
Thematic analysis
A thematic analysis of the interviews was carried out. A thematic analysis is a systematic method for identifying main themes in text material (Braun & Clarke, 2006). In the analyses, we focused on identifying themes that reflect the interviewees' descriptions of conditions that have promoted or hindered the process of implementing Traffic Safe Municipality. In the first step of the process, the interviews were read carefully several times, and then coded. The codes were then systematized and arranged in rough categories. In the next step, the resulting categories were reviewed. In this part of the process, we assessed the categories against each other and against the material, and necessary adjustments were made. Some categories described the same overarching concept and were merged, and others distinguished themselves as subcategories under a larger overarching factor.
Survey
Recruitment and implementation
We have recruited 2 255 respondents from a total of 24 municipalities for a survey about the consequences of being approved as a Traffic Safe Municipality. The average number of respondents from each municipality is 94. The lowest number of respondents from a municipality is 34, while the highest number of respondents is 199. The municipalities in the survey are all municipalities that participated in the approval process for Traffic Safe Municipality in the period January 2019 to November 2020. Respondents were recruited through The Norwegian Road Safety Council (Trygg Trafikk) during this period. The coincil sent out the survey to contact persons in each municipality. The contact persons then sent out a link to the respective units in the participating municipalities. Based on the decentralized recruitment method, it is not possible to say anything about response rates. We do not know the number of people who received the link and thus had the opportunity to participate.
Sending out the survey was usually done a few months before The Norwegian Road Safety Council's approval meetings with the municipalities. Ahead of these meetings, the Institute of Transport Economics took out aggregated results from the surveys in each municipality, so the council and the relevant municipality could discuss the results in the approval meeting. The background for this was to facilitate an awareness among the employees in the participating municipalities, create joint discussion of various topics and possibly point out areas in which the municipality could improve, based on the survey. The purpose was to facilitate a continuous improvement process in the municipality. The results of the survey had nothing to do with the approval process, which was linked to the formal fulfillment of the criteria of Traffic Safe Municipality (cf. section 1.4).
Themes in the survey
Background questions: gender, age, sector (kindergarten, school, home care, municipal engineering), position level in the municipality.
Knowledge of Traffic Safe Municipality. Two statements measure this:
-
‘I am well aware that my municipality is a Traffic Safe Municipality.’
-
‘I am well aware of what it means to be a Traffic Safe Municipality.’
The answer options vary from 1 (completely disagree) to 5 (completely agree). We have made a sum score index of these two variables (min: 2, max: 10; Cronbach’s Alpha: 0.798). We use this sum score index as a general measure of the implementation of Traffic Safe Municipality.
Top management focus on traffic safety :
-
‘The municipality's top administrative management regards traffic safety as very important.’
-
‘The municipality's mayor regards traffic safety as very important.’
The answer options vary from 1 (completely disagree) to 5 (completely agree). Here we also have a sixth answer option (don't know/not relevant). We have removed the sixth answer alternatives and created a sum score index (min: 2 points, max: 10 points) of the two statements (Cronbach’s Alpha: 0.809).
Perceived effects of the municipality becoming a Traffic Safe Municipality. The survey contains several statements that measure various perceived effects of being approved as a Traffic Safe Municipality. These were preceded by the text: 'Here come statements about potential consequences of being approved as a Traffic Safe Municipality. The fact that we have been approved as a Traffic Safe Municipality has led to: ...'
Three statements measured perceived improvements in traffic safety culture:
-
‘My immediate manager signals more clearly than before that traffic safety is important at my workplace.’
-
‘My colleagues have become more concerned with traffic safety.’
-
‘It has become easier to raise questions concerning traffic safety at my workplace.’
We combine these statements into a sum score index (min: 3, max: 15) that measures the perceived improvements in traffic safety culture of being approved as a Traffic Safe Municipality (Cronbach’s Alpha:0 .795).
Two statements measured perceived consequences for respondents’ own focus on traffic safety:
-
‘I think more about traffic safety in my everyday work.’
-
‘I have learned how all the municipality's departments can contribute to traffic safety.’
One statement measured respondents reports of changes in their own traffic safety behaviour:
-
‘I behave more safely when traveling in traffic during working hours, whether I am a pedestrian, cyclist or car driver.’
One statement measured perceptions of consequences for traffic safety in the municipality:
-
‘Traffic safety has increased for the residents of our municipality.’
Analyses
Regression analysis. We carried out three regression analyses in the present study. In the first regression analysis, we examined factors explaining variation in respondents' assessments of traffic safety culture change, after being approved as a Traffic Safe Municipality. In the second, we examined factors explaining whether respondents think more about traffic safety as a result of the implementation of the Traffic Safe Municipality criteria. In the third, we examined whether they report that they behave more safely when traveling in traffic due to the implementation of the criteria. We have used linear regression, since the dependent variables are continuous. The regression analyses show effects of the independent variables that we include, controlled for the other variables in the analysis. It must be pointed out that we cannot say anything about causal relationships in these analyses. Moreover, some of the relationships we see may actually be due to so-called ‘unmeasured’ third variables.
Results
Characteristics of the respondents
Table 1 shows the age distribution of the respondents.
|
Age |
Per cent |
Count |
|---|---|---|
|
< 26 years |
4% |
95 |
|
26–35 |
16% |
369 |
|
36–45 |
24% |
532 |
|
46–55 |
34% |
758 |
|
56+ |
22% |
501 |
|
TOTAL |
100% |
2 255 |
We see that 58% of respondents are between 36 and 55 years old. A total of 75% (n = 1685) of the respondents in the sample are women, while 25% are men (n = 570). The high proportion of women can be explained by showing which sectors in the municipality the respondents are recruited from. This is particularly the primary school, home care and kindergartens, where women are in a clear majority.
Table 2 shows the sectors in which the respondents are employed.
|
Sector |
Per cent |
Count |
|---|---|---|
|
Kindergarten |
18% |
412 |
|
School |
32% |
731 |
|
Homeservice |
26% |
578 |
|
Municipality management group |
8% |
177 |
|
Municipal engineering |
16% |
357 |
|
TOTAL |
100% |
2 255 |
Table 3 shows at which administrative level in the municipality the respondents work.
|
Level |
Per cent |
Count |
|---|---|---|
|
Municipality management group |
9% |
177 |
|
Head of municipal agency, department, unit |
10% |
196 |
|
Intermediate manager of a municipal agency, department, unit |
8% |
160 |
|
Other manager |
6% |
117 |
|
Employee |
66% |
1 248 |
|
TOTAL |
100% |
1 898 |
Two thirds of the respondents define themselves as employees. The total number of respondents in the table is lower than in Table 2, because we lack information on administrative level for the respondents from municipal engineering.
Consequences of being approved as a Traffic Safe Municipality
The first aim of the study is to examine whether implementation of the criteria for Traffic Safe Municipality is related to perceptions of safety culture improvements among respondents in the approved municipalities.
Traffic safety culture in the workplace
The survey includes three statements that measure perceived changes in traffic safety culture in the workplace related to the process of implementing the Traffic Safe Municipality criteria and being approved. First, 67% of respondents agree with the statement that managers signal more clearly than before that traffic safety is important, 62% agree with the statement that colleagues have become more concerned with traffic safety, while 58% agree that it has become easier to raise questions relating to traffic safety in the workplace. These results are in line with Hypothesis 1: ‘Implementation of the criteria for Traffic Safe Municipality has led to perceptions of safety culture improvement in the approved municipalities.’
The quantitative results correspond with the results from the qualitative interviews. It was mentioned that there is an improved climate for addressing traffic safety issues, and that the arguments for traffic safety have gained more weight when the municipality is approved as a Traffic Safe Municipality, especially when they receive support from the municipality's top management. Several interviewees also mentioned that both colleagues and residents use the fact that the municipality is approved as a Traffic Safe Municipality as an argument in discussions related to traffic safety. The status as Traffic Safe Municipality has become a common point of reference, legitimizing and justifying an increased focus on traffic safety. Colleagues and residents in the municipality may, for example, tell each other that they cannot act unsafe in traffic when the municipality is approved as a Traffic Safety Municipality.
In one municipality, for example, it was mentioned that some parents had previously secured their children in inadequate ways in the car, and that this was reported by the staff at the kindergarten. It was mentioned that the parents initially had replied that this was not something that the kindergarten staff should interfere with, as this was a private choice of the parents. The kindergarten staff had replied that the contrary was the case, as the municipality was a Traffic Safe Municipality. The attitude of the parents had gradually changed, it was said. It was also mentioned that in this municipality, the kindergarten staff had changed the car park traffic safety behaviour of all the parents in the kindergarten. The kindergarten staff said that all parents must always reverse their cars into place in the car park. All parents complied with this within two days. This illustrates how the change in traffic safety culture in relationship with being approved as a Traffic Safe Municipality applies to both staff in the kindergarten and parents. It was also mentioned that because of the traffic safety training in the kindergarten, the children became small ‘traffic police’, sanctioning parents who did not wear seat belts etc.
Respondents own focus on traffic safety
The second aim of the study was to examine whether potential changes in safety culture are related to respondents' self-reported increased focus on traffic safety in their work activities. A share of 73% of respondents agree with the statement that they think more about traffic safety than before after being approved as a Traffic Safe Municipality, while 36% agree that they have learned more about how all departments can contribute to traffic safety. Between 56% (Municipality N) agree and 83% (Municipality D) agree with the statement that they think more about traffic safety. However, it is important to remember that, as we have not defined what it means to ‘think more about traffic safety’, this corresponds to ‘more than before the municipality was approved as a Traffic Safe Municipality’. 2
Results from the qualitative interviews also indicate that people think more about traffic safety. It was mentioned that Traffic Safe Municipality has led to an awareness in the municipality related to how the employees can influence traffic safety in their work. The interviewee from Municipality E said, for example, about Traffic Safe Municipality that:
‘It helped to highlight how important work [with traffic safety] was done at the children health clinic and in schools. The same with the kindergartens. They do a great job with parents. It is an awareness raising in schools and kindergartens when they have to answer the form [with the approval criteria] and when they are encouraged to have a traffic safety plan. Then it created an awareness of what work is actually being done in that area. They were able to sign off on most of the requirements that The Norwegian Road Safety Council made. It makes visible that the preventive work that schools and kindergartens do also includes traffic safety, not just health.’
Respondents own traffic safety behaviour
The survey contains the following statement: ‘The fact that we have been approved as a Traffic Safe Municipality has led to: “I behave safer when I travel in traffic during working hours, whether I am a pedestrian, cyclist or motorist” ’. Among the respondents, 3% completely disagreed, 3% somewhat disagreed, 23% answered neither nor, while 30% somewhat agreed and 39% completely agreed. A proportion of 2% answered ‘don't know/not relevant’. The proportions who agreed varied between 79% (Municipality M) and 62% (Municipality L).
These results also harmonize well with the results from the qualitative interviews, which indicate that Traffic Safe Municipality has had consequences for traffic safety behavior in many ways. Interviewees mentioned examples of safer behaviour in traffic, in accordance with survey results. Interviewees also mentioned that they sanctioned other people who behave in unsafe ways in traffic, saying, for example, that ‘you can't behave like that when you live in a Traffic Safe Municipality.’ The examples used were securing children in cars and buses. Examples were also mentioned of adults sanctioning young people who ‘drive rough’ in the municipality by stating that this is not OK and reminding that the municipality is a Traffic Safe Municipality. Thus, results indicate that the status as a Traffic Safe Municipality has changed the traffic safety culture, in the sense that it has become a common point of reference, legitimizing and justifying safer behaviours in the municipalities. Finally, interviewees also mentioned other types of traffic safety behaviour changes, for example that they carry out risk analyzes related to traffic safety in their work. It was mentioned that Traffic Safe Municipality has led to a number of new routines of this type.
Factors that inhibit and promote implementation
The third aim is to map factors that promote or inhibit the implementation of Traffic Safe Municipality. In the following, results from the thematic analysis of the interviews are presented.
Involvement from top management. It is the first promoting factor that we have identified in the analysis. Several of those we interviewed mentioned that support from the municipal management was of great importance for the anchoring of Traffic Safe Municipality in the various agencies in the municipality. This indicates that it is very important that the municipal director and mayor have participated in the process and have shown their support for the initiative politically. First, this support is important to legitimize that this is something the municipality commits to and will work with in all the units in the municipality:
‘It is absolutely necessary that the mayor says that we should go for it. When the mayor and the management group are involved, the entire municipality becomes involved. Political decision is important for the result.’ (Interviewee, Municipality Q)
Second, involvement from top management is important for the extent to which the measure is formalized in the organization, through planning, objectives and traffic safety plans, and third, it seems to be important for creating commitment among managers and employees in the various agencies.
Continuity and dedicated personnel. In order for employees to be aware of what it means to be a Traffic Safe Municipality, it must be put regularly on the agenda and followed up in the organization. A dedicated promoter who is responsible for coordinating and following up the work towards the municipal units was mentioned by several as absolutely crucial for the successful implementation and follow-up in the organization.
‘If you don't have a person who takes care of it and who coordinates it, then no one will take care of it.’ (Interviewee, Municipality X)
‘It requires a committed person. It requires that a person with responsibility has been added, and that it is anchored in governing documents, so that it is not perceived as something that I, as a consultant, have made up.’ (Interviewee, Municipality S)
An important aspect of this is to have a person with the resources and time to work continuously with the initiative. An equally important aspect that was highlighted is that the person has the interest and willingness to take on such a role. Many municipalities generally experienced a high turnover and replacement of personnel. In the interviews, this was mentioned by several as one of the most important challenges for coordinating and following up the work with Traffic Safe Municipality.
‘That [replacement of personnel] is the big challenge here. In a municipality, employees will always be replaced. In order for it [Traffic Safe Municipality] to function optimally, you need someone who has dedicated time to update and ensure that things are done.’ (Interviewee, Municipality H)
Good internal communication. To anchor the initiative in the various units, the importance of having established contact points with relevant managers and people was highlighted as a central success criterion by several interviewees.
Competing priorities in the municipality and high workload. In many municipalities, traffic safety is not regarded as the biggest challenge, and there may thus be other priority areas or objectives that are emphasized more. Several interviewees believed that anchoring the measure formally in planning and routines was very important, to achieve a good implementation. Without formal anchoring, it is easy for the work to be de-prioritized at the expense of other prioritized tasks. Compliance with the municipality's other priority areas/objectives is also important. The municipal employees generally have a high workload, which makes it challenging to set aside time to work with Traffic Safe Municipality in a busy working day.
External factors. All interviewees mentioned assistance from The Norwegian Road Safety Council as an important support in the work to introduce the measure. Both the administrative aids in the form of checklists and routines, but also professional assistance in adapting the measure to the municipality were mentioned. Other external factors mentioned by the interviewees was the support from county safety councils allocating funding, and that Traffic Safe Municipality is mentioned in the National Transport Plan. The interviews also indicate the importance of two negative external factors. The first is reorganization followed by county and municipal mergers, which occurred in 2020. This has required large administrative resources for some municipalities. The second factor was the COVID-19 pandemic in 2020, which created major upheavals and many additional tasks for the municipalities, leaving less time to work with Traffic Safe Municipality.
‘There is a state of emergency in the municipality during the day. Many things are higher on the priority list than traffic safety. Infection control and outbreaks and everything else.’ (Interviewee, Municipality H)
Multivariate analyses
What influences effects on municipal traffic safety culture?
The dependent variable in the first multivariate analysis is: ‘Perceived improvement in municipal traffic safety culture of being approved as a Traffic Safe Municipality’. This is an index combined of three statements (cf. Section 2.2.2). Table 4 shows mean scores on the variable perceived improvements in municipal traffic safety culture of being approved as a Traffic Safe Municipality, for the highest and lowest scoring municipality, for different sectors within the municipality and different age groups.
|
Variable |
Values |
Mean |
SD |
N |
|---|---|---|---|---|
|
Municipality |
Municipality D |
12.6 |
47 |
2.5 |
|
Municipality N |
10.8 |
73 |
3.0 |
|
|
Sector |
Kindergarten |
13.1 |
427 |
2.1 |
|
Municipality management group |
12.3 |
158 |
2.3 |
|
|
School |
12.0 |
641 |
2.4 |
|
|
Municipal engineering |
11.3 |
320 |
2.8 |
|
|
Home service |
10.7 |
524 |
2.8 |
|
|
Age groups |
< 26 years |
11.6 |
84 |
2.5 |
|
26–35 years |
11.6 |
327 |
2.8 |
|
|
36–45 years |
11.8 |
499 |
2.5 |
|
|
46–55 years |
12.0 |
704 |
2.6 |
|
|
over 56 years |
11.8 |
456 |
2.6 |
We control for municipality in the analyses, because the municipalities' scores on the dependent variable vary. Municipality D with the highest score on the dependent variable has a 17% higher score than Municipality N, which had the lowest score on the index. The variable ‘Municipality D’ has two values: (1) All other municipalities in the sample and (2) Municipality D. We also control for sector in the analyses, since the sectors' scores on the dependent variable vary considerably. Kindergartens have the greatest reported effects on traffic safety culture The variable ‘Sector’ consists of two values: (1) The other sectors, (2) Kindergarten. We control for administrative level (employee, manager), since we can assume that people in management functions have more knowledge of Traffic Safe Municipality than employees without management responsibilities. The reason is that managers often are involved in the implementation of Traffic Safe Municipality and fulfillment of the criteria for Traffic Safe Municipality. The variable ‘Position level’ consists of two values: (1) manager, (2) employee.
In the multivariate analyses, we also control for the age of the respondents, because respondents under the age of 26 score the lowest on the variable perceived improvement in traffic safety culture. We also include the variable top management's focus on traffic safety, since previous research suggests that this is the most important aspect of safety culture.
|
Variable |
Mod. 1 |
Mod. 2 |
Mod. 3 |
Mod. 4 |
Mod. 5 |
Mod. 6 |
|---|---|---|---|---|---|---|
|
Age (< 26 years = 2) |
-.017 |
-.019 |
-.007 |
-.007 |
.000 |
.014 |
|
Sector (Kindergarten = 2) |
*** .236 |
*** .228 |
*** .227 |
*** .195 |
*** .127 |
|
|
Position level (Employee = 2) |
*** -.072 |
*** -.074 |
.018 |
*** .070 |
||
|
Municipal D (= 2) |
** .054 |
.023 |
.007 |
|||
|
Top management focus |
*** .485 |
*** .291 |
||||
|
Knowledge of TSM |
*** .384 |
|||||
|
Adjusted R2 |
.000 |
.055 |
.059 |
.062 |
.286 |
.380 |
* p < 0.1; ** p < 0.05; *** p < 0.01
The analyses show that the index ‘Knowledge of Traffic Safe Municipality (TSM)’ is the variable which has the largest contribution to respondents' perceived improvements in municipal traffic safety culture. This is, as mentioned earlier, the most important measure we have for implementation of Traffic Safe Municipality.
The analyses in Table 5 also show that the commitment of top management in the municipality (municipal director/mayor) to traffic safety contributes significantly, followed by the sector (kindergartens). Municipality D, which is the municipality with the highest score on the dependent variable, also contributes significantly until top management's commitment and knowledge of Traffic Safe Municipality (i.e. degree of implementation) are taken into account. This means that there is a relationship between municipality, top management's commitment and the implementation of Traffic Safe Municipality, and that the last two variables largely explain why Municipality D has the highest score for effects on traffic safety culture. The adjusted R2 value is 0.380, and indicates that the variables in the model explain 38% of the variation in the respondents' scores on the index for effects on traffic safety culture.
What influences whether respondents think more about traffic safety?
The survey contains the statement ‘The fact that we have been approved as a Traffic Safe Municipality has led to: “I think more about traffic safety in my everyday work.” ’ In Table 6, we examine the independent variables influencing this variable.
|
Variable |
Mod. 1 |
Mod. 2 |
Mod. 3 |
Mod. 4 |
Mod. 5 |
Mod. 6 |
Mod. 7 |
|---|---|---|---|---|---|---|---|
|
Age (< 26 years = 2) |
.008 |
.006 |
.019 |
.020 |
.025 |
* .038 |
* .032 |
|
Sector (Kindergarten = 2) |
*** .203 |
*** .194 |
*** .194 |
*** .172 |
*** .105 |
** .041 |
|
|
Position level (Employee = 2) |
*** -.078 |
*** -.079 |
-.017 |
.033 |
.000 |
||
|
Municipal D (= 2) |
** .059 |
* .038 |
.023 |
.019 |
|||
|
Top management focus |
*** .330 |
*** .142 |
-.003 |
||||
|
Knowledge of TSM |
*** .371 |
*** .180 |
|||||
|
Effect on TSC |
*** .499 |
||||||
|
Adjusted R2 |
.000 |
.040 |
.045 |
.048 |
.152 |
.239 |
.393 |
* p < 0.1; ** p < 0.05; *** p < 0.01
The analyses in Table 6 show that the variable ‘Effect on traffic safety culture (TSC) of being approved as a Traffic Safe Municipality’ is the variable that contributes the most in the analyses. It indicates that respondents who experience an improved traffic safety culture because of the implementation of Traffic Safe Municipality (i.e. increased focus on traffic safety among managers and employees at their own workplace) also report that they think more about traffic safety in their everyday work.
Another variable that contributes significantly is knowledge of Traffic Safe Municipality. We use this as a measure for the implementation of measures. We saw in the analyses above that these two are strongly correlated. We also see that the contribution of the variable knowledge of Traffic Safe Municipality is reduced when we take into account the effect on traffic safety culture.
Top management's focus on traffic safety contributes significantly until we include the effect on traffic safety culture in Model 7, showing that these two variables are strongly correlated. Top management's focus is also correlated with Municipality D, which is the municipality with the highest score on the index for traffic safety culture. It seems that this can be explained by management's focus on traffic safety. Sector, that is kindergartens also contributes significantly to the analyses, but this contribution is significantly reduced when we include the effect on traffic safety culture in Model 7. This indicates that there is a relationship between the effect on traffic safety culture and the kindergarten sector. This indicates that part of the reason why the respondents in the kindergartens think more about traffic safety culture as a result of being a Traffic Safe Municipality is related to effects on traffic safety culture. The adjusted R2 value is 0.393. This indicates that the variables in the model explain 39% of the variation in the respondents' scores on the variable that measures whether people think more about traffic safety.
What influences whether the respondents behave more safely in traffic?
The survey also contains a statement about the change in traffic safety behavior as a result of the municipality becoming a Traffic Safe Municipality: ‘The fact that we have been approved as a Traffic Safe Municipality has led to: “I behave more safely when I travel in traffic during working hours, whether I am a pedestrian, cyclist or car driver.” ’
|
Variable |
Mod. 1 |
Mod. 2 |
Mod. 3 |
Mod. 4 |
Mod. 5 |
Mod. 6 |
Mod. 7 |
Mod. 8 |
|---|---|---|---|---|---|---|---|---|
|
Age (< 26 years = 2) |
* .042 |
* .041 |
* .046 |
** .047 |
** .051 |
*** .060 |
** .054 |
*** .043 |
|
Sector (Kindergarten = 2) |
*** .146 |
*** .143 |
*** .143 |
*** .123 |
*** .079 |
.031 |
.018 |
|
|
Position level (Employee = 2) |
-.032 |
-.033 |
.025 |
** .056 |
.030 |
.030 |
||
|
Municipal D (= 2) |
.032 |
.013 |
.004 |
.002 |
-.004 |
|||
|
Top management focus |
*** .298 |
*** .177 |
** .065 |
*** .065 |
||||
|
Knowledge of TSM |
*** .240 |
*** .090 |
.029 |
|||||
|
Effect on TSC |
*** .387 |
*** .215 |
||||||
|
Think more about TS |
*** .342 |
|||||||
|
Adjusted R2 |
.001 |
.022 |
.023 |
.023 |
.107 |
.144 |
.236 |
.306 |
* p < 0.1; ** p < 0.05; *** p < 0.01
The analyses in Table 7 show that the fact that the respondents think more about traffic safety as a result of the municipality becoming a Traffic Safe Municipality is the variable that contributes the most to the respondents' stated changes in traffic safety behaviour.
Another variable that contributes significantly to the respondents' reported changes in traffic safety behavior is effects on traffic safety culture, of being approved as a Traffic Safe Municipality. As we have seen above, the variables effect on traffic safety culture and thinking more about traffic safety are strongly correlated. We also see this in the analyzes in Table 7, since the contribution to the former is significantly reduced when we include the second variable in Model 8.
Top management's focus on traffic safety also contributes significantly, but the contribution of this variable is small. However, we see that the contribution of senior management's focus on traffic safety is gradually reduced when we include variables that measure the degree of implementation of Traffic Safe Municipality and effects on traffic safety culture, which shows that senior management's focus on traffic safety is correlated with these variables.
The adjusted R2 value is 0.306, indicating that the variables in the model explain 31% of the variation in the respondents' scores on the variable that measures effects on their own traffic safety behaviour.
Discussion
The relationship between SMS and safety culture
The first aim of the study was to examine whether implementation of the criteria for Traffic Safe Municipality is related to perceptions of safety culture improvements among respondents in the approved municipalities. Our first hypothesis was that implementation of the criteria for Traffic safe municipality has led to perceptions of safety culture improvement in the approved municipalities. Our results largely support Hypothesis 1, as respondents report positive changes in safety culture. The background for Hypothesis 1 is, first, that, based on previous research, we assumed that the implementation of the criteria for Traffic Safe Municipality has led to new ways of thinking and acting in relation to traffic safety. The assumed main explanation for the relationship between SMS and safety culture is that it is assumed that the development of formal procedures (‘how things should be done’) will influence informal practice (‘how things are actually done’) and facilitate new (joint) ways of acting in the organizations (Nævestad et al., 2018). This is the explicit motivation and justification for most of the sector legislation that requires SMS (ERA, n/d; ICAO, 2016; IMO, n/d). The relationships we have seen between the implementation of Traffic Safe Municipality and reported traffic safety culture improvements in the quantitative data support this assumption. So does the qualitative data. We received several good examples of new routines being introduced in the municipalities that took place in the study, for example relating to risk analyses, travel policies etc. In addition, the respondents in the survey report that they behave in a safer way when traveling in traffic at work.
Increased focus on traffic safety
The second aim of the study was to examine whether potential changes in safety culture are related to respondents’ self-reported increased focus on traffic safety in their work activities. SMS interventions are often based on the assumption that when the new ways of acting are introduced, these will lead to new (common) ways of thinking, or new ways of understanding hazards in the work (Kongsvik & Gjøsund, 2016; Lappalainen et al., 2012; Naveh & Katz-Navon, 2015; Phillips et al., 2018). The results of the survey support this assumption, because the respondents state that they think more about traffic safety, and because they state that they have learned more about how all the municipality's departments can contribute to increased traffic safety. We also saw this in the qualitative data, where a new ‘awareness’ was a word that was repeated as an example of an important consequence of being approved as a Traffic Safe Municipality. It was mentioned, for example, that approval as a Traffic Safe Municipality leads to a greater awareness of how different agencies in the municipality can have an indirect and direct influence on traffic safety. Thus, our results support Hypothesis 2: ‘Perceptions of traffic safety culture improvements are related to respondents' self-reported increased focus on traffic safety in their work’. Previous research also indicates that new ways of understanding hazards in work may motivate and reinforce the new ways of acting (Nævestad et al., 2021; Nævestad, 2010). Our results also resonate with this, because we find a relationship between thinking more about traffic safety and behaving in a safer way in traffic during working hours.
The relationship between culture and behaviour
The third aim of the study was to examine whether potential changes in safety culture are related to self-reported improvements in respondents’ traffic safety behaviours. We find that self-reported improvements in traffic safety culture has an isolated effect on traffic safety behaviours in the multivariate analyses. This result is in line with Hypothesis 3: ‘Perceptions of traffic safety culture improvements are related to self-reported traffic safety behaviour improvements among the respondents‘. The result is also in accordance with previous research (Naveh & Katz-Navon, 2015; Zuschlag et al., 2016). Moreover, in line with the mentioned previous research, we find that SMS influences safety behaviour as it leads to safety culture change. In the multivariate analysis of factors influencing traffic safety behaviours, we found that the variable measuring SMS implementation ceased to contribute significantly when the traffic safety culture variable was introduced.
However, the most important predictor of changes in respondents’ traffic safety behaviours in the multivariate analyses was the variable 'Think more about traffic safety' (as a result of being approved as a Traffic Safe Municipality). This result indicates that the most important mechanism between safety culture change and safety behaviour change goes through respondents’ self-reported thoughts about traffic safety. It seems that safety culture change makes respondents think more about traffic safety and subsequently act safer in traffic. The relationship between thought and actions has been investigated in a number of different psychological theories and studies. According to the 'expectancy value model', the attitude towards a certain behavior is influenced by perceptions of the consequences, which are weighed by the subjective value of the consequences (Fishbein & Ajzen, 1975). Theory of Planned Behavior (TPB) again describes how attitudes are shaped into behavioral intentions and behaviour. The TPB assumes that our behavior is a result of our intention to perform the behavior, and that our intention to perform a specific behavior is influenced by our attitudes to the behavior, subjective norms and our perceived control over our own behavior (Ajzen, 1991).
The above-mentioned isolated effect of traffic safety culture change on behaviour change seems to indicate mechanisms additional to the relationship between thoughts and actions. This mechanism might be related to what colleagues do (‘descriptive norms‘) and, for example, the management focus on traffic safety. The contribution of the variable 'Top management focus on traffic safety' is reduced when the variable traffic safety culture change is introduced, indicating that the direct contribution of traffic safety culture change is related to this. The importance of management focus as a facilitating variable, was also highlighted in the qualitative data and in previous research (Flin et al., 2000; Thomas, 2012). Thus, we have identified at least two mechanisms between safety culture change and safety behavior change, that should be examined further in future research. The third potential mechanism ‘descriptive norms’, or ‘peer pressure’ in the workplace, should also be examined in future research. Qualitative interview data indicates that the safety culture changes involved new shared points of reference, legitimizing and justifying safer traffic safety behaviours (and also sanctioning of unsafe driving among inhabitants).
Factors that impede or facilitate
The fourth aim of the study was to map factors that promote or inhibit implementation of a Traffic Safe Municipality. Although we have seen consistently positive results of being approved as a Traffic Safe Municipality, both the implementation and the results varied in the various municipalities. The interviews indicate that this is related to the quality of the implementation of the criteria for Traffic Safe Municipality, and different factors influencing this.
When it comes to factors that promote implementation, quantitative and qualitative results indicate that top managers' commitment throughout the intervention period is one of the most important prerequisites for a successful implementation. This result, which is in accordance with Hypothesis 4, is also emphasized in several previous studies from many different sectors (Edkins, 1998; Flin et al., 2000; Lappalainen et al., 2012; Thomas, 2012; Zuschlag et al., 2016). The fact that Traffic Safe Municipality is something that top management is concerned with and puts on the agenda helps to legitimize the measure and to highlight it as an important priority area in the municipality.
When it comes to factors inhibiting implementation that are identified in our analysis, these are largely about organization and available resources, rather than factors related to the SMS measure that is implemented (Traffic Safe Municipality). In our analysis, we find that a lack of resources in the municipality, time pressure and high workload among employees seem to be the most important factors that may make it challenging to implement Traffic Safe Municipality in daily work. This matches with previous research on the implementation of SMS and safety culture, which shows that if managers and employees experience strong work pressure, they may have little time to work with SMS, and this can affect the quality of the process (Bye & Aalberg, 2020; Størkersen et al., 2020). Municipal employees generally have many tasks and often have to prioritize important tasks over others. The COVID-19 pandemic is an example of an acute and unforeseen situation that has required a lot of resources. Reorganisation and replacement of personnel are also important challenges. This also matches with findings from several studies which show that reorganization and replacements of people who have important roles in the introduction of a measure can have negative effects on the implementation of the measure (Amtrak, 2015; Zuschlag et al., 2016).
Model of relationships
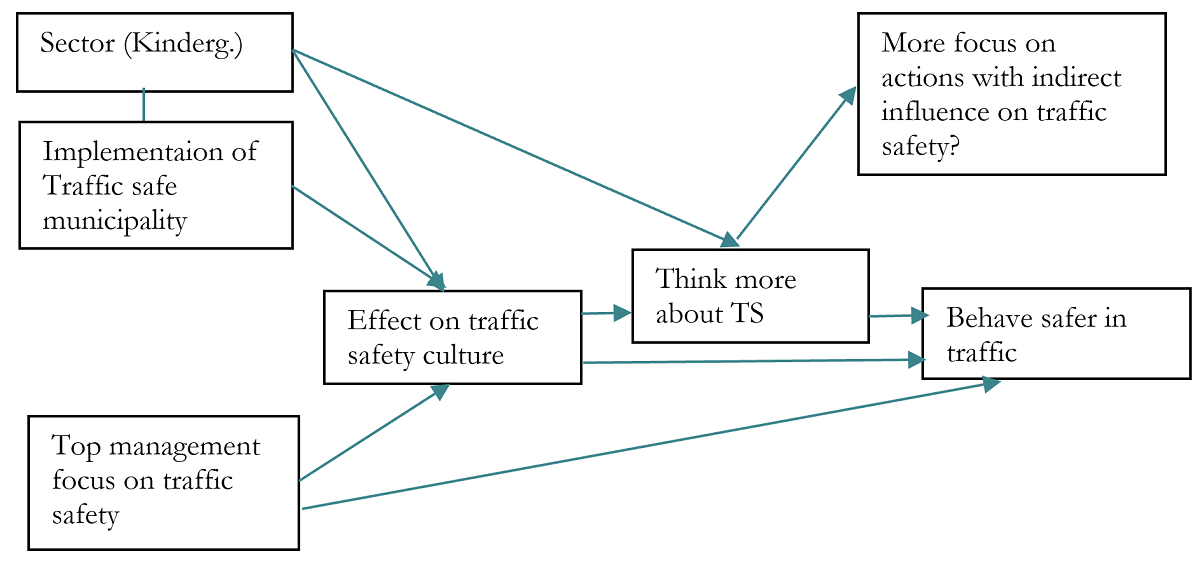
We illustrate the links that we observed in the multivariate analyzes in Figure 1. The figure indicates relationships between: (1) Influencing factors, (2) system implementation, (3) development of safety culture, and (4) safety behaviour. The most important variable related to perceived traffic safety culture change was the variable measuring implementation of Traffic Safe Municipality criteria. The most important variable related to whether respondents report that they think more about traffic safety was perceived changes in traffic safety culture. The most important variable related to respondents’ reports that they behave safer in traffic was that they think more about traffic safety. Finally, it is also important to note that the model assumes both direct and indirect effects on traffic safety. The first occurs through the influence of employees' safety behavior in traffic. The second occurs as employees in the municipality indirectly influences traffic safety. We have unfortunately not measured the indirect influence quantitatively.
Methodological weaknesses and strengths
Unknown response rate. We have not calculated response rates for the various municipalities and sectors, because we lack information on the number of people who have received the link to the survey. However, it is a strength that we have a large sample of respondents and a relatively large number of municipalities in the survey.
Representativity of municipalities. When we assess the results, it is important to consider how representative the municipalities that have responded to the survey are for the population of municipalities that are Traffic Safe Municipalities. This is especially true when we do not know the response rate. Hypothetically, there may be reason to assume that the municipalities that have participated are particularly dedicated. However, it can be noted that the variation in the results suggests that this is not necessarily the case. It must also be mentioned that we have recruited the municipalities that were about to be re-approved over almost two years. There is therefore reason to believe that the participating municipalities are representative of Traffic Safe Municipalities in general.
Representativity of respondents. Another relevant question is how representative the respondents who have answered are. We have seen that 75% of the respondents are women. At the same time, 76% of the respondents were recruited from kindergartens, schools and the municipality's home care. Comparable information from Statistics Norway shows that 90% of kindergarten staff are women, while 75% of primary school teachers are women (SSB, 2018). The high proportion of women in our sample thus appears to be in line with the proportion of women in the groups from which we have recruited the most respondents.
Our conclusions are largely based on self-reported numbers. A possible limitation is that our conclusions are based on self-reported numbers, with the possible biases that this may entail. Respondents can, for example, remember incorrectly, they can potentially over-report positive things and under-report negative things, etc. These are known issues when using self-reported data. However, we have no indications of substantial effects of this in our data.
We have not conducted a before and after study with a control group. A major weakness of the present study is that it is a cross-sectional study. If we had carried out a before and after studies with both test and control groups, we could potentially have gained better control over cause and effect in the study (cf. section 4.7.1). Moreover, it is also more likely that we could have gained better control over the effect of implementation of the Traffic Safe Municipality criteria compared, for example, with the general development in society over time such as an increased focus on traffic safety. Nevertheless, it is important to note that we also see variation among the municipalities in our relatively large sample, and we get important information about relationships between key variables, that can be examined further in future research.
We do not estimate the effect on accidents. Actual traffic accidents are the most important measure of the effect of traffic safety measures, because this is what you want to influence with traffic safety measures. However, we do not estimate the effect on accidents in our study. The reason is that we are focusing on Traffic Safe Municipality as a traffic safety culture initiative, that the number of accidents in the participating municipalities is small, and because we have reason to believe from previous studies that there is a relationship between safety culture and traffic accidents (Bjørnskau & Nævestad, 2013). It is particularly important to focus on traffic safety culture as an outcome measure for traffic safety, since the number of accidents and injuries in traffic has decreased dramatically over the past 20 years. With a small number of people killed and injured in traffic, the numerical basis for assessing the effects of measures is smaller. Then alternative indicators, such as traffic safety culture, are a good solution because these provide a broad and multifaceted measure of traffic safety, which we know from previous studies is related to behaviour, incidents and accidents (Bjørnskau & Nævestad, 2013).
Questions for future research
What comes first: SMS or safety culture?
A main assumption in this study is that the introduction of SMS represents an important way of developing a good safety culture. To this assumption, it must be mentioned that there is no automaticity in this relationship. Although we have seen consistently positive results from being approved as a Traffic Safe Municipality, both the implementation and the results varied in the various municipalities. This means that some of the municipalities may have met most of the criteria for a Traffic Safe Municipality, without these criteria being as 'alive' as in other municipalities. Or in other words: they have not been able to develop the same culture, although they to some extent have the same system in place. We have discussed this in light of the different impeding and facilitating factors.
Second, it must be mentioned that it is difficult to know what comes first when we look at SMS and culture. The observed relationship between Traffic Safe Municipality criteria implementation and self-reported safety culture improvements may be due to at least two mechanisms: (1) municipalities with a good traffic safety culture choose to become a Traffic Safe Municipality and observes further improvements, and (2) municipalities with a poor traffic safety culture choose to become a Traffic Safe Municipality and observes improvements. As this is a cross-sectional study with no ‘before measurements’ of safety culture, we cannot conclude about causality. Additionally, safety culture and SMS mutually influence each other in organizations, and it is therefore demanding to distinguish between them analytically.
We need to measure additional types of behaviour
An important limitation of the study is that we have only measured traffic safety behaviour as behaviour in traffic. One of the main principles behind Traffic Safe Municipality is that municipalities have an indirect influence on traffic safety in a number of areas, for example as a road owner, as a transport buyer, within training and education in kindergartens, schools, health clinics, etc. Our analyses indicate that respondents think more about how they influence traffic safety in their work, and we should also have measured changes in their behaviours indirectly influencing traffic safety as road owners, transport buyers, etc. These things relate to how municipality personnel indirectly set the premises for traffic safety in the municipality through their actions, plans and priorities. This is an important issue for future research.
Maintaining the safety culture changes
We have identified perceived safety culture changes, new ways of thinking and perceived behavioural changes, but we do not know how long these changes will last, or how to uphold them over time. Thus, these are crucial questions for future research. Based on our results on factors influencing implementation, we can however speculate. There was agreement that the approval process was an important driver of the studied changes, as fulfillment of the Traffic Safe Municipality criteria requires systematic efforts and awareness raising within the different municipal agencies. Thus, the re-approval which will happen every third years was considered important to maintain the changes. This is also reported in other studies of companies that have implemented different types of safety management certification systems, such as ISO:39001 (Nævestad & Milch, 2021; Nævestad et al., 2020). Additionally, based on our study, we may assume that factors like top management support, dedicated personnel, sector (e.g. kindergarten) and competing priorities may influence the durability of the safety culture changes. The most crucial factor is management support (Edkins, 1998; Lappalainen et al., 2012; Thomas, 2012; Zuschlag et al., 2016). We may assume that the status as Traffic Safe Municipality as a common point of reference legitimizing and justifying certain traffic safe behaviours is more likely to be upheld as long as top municipal managers view it as important.
Conclusion
The study shows a positive relationship between implementation of the criteria for Traffic Safe Municipality and perceptions of safety culture improvements in the studied municipalities. We also found that perceived safety culture improvement is related to increased self-reported focus on traffic safety in the respondents' work and self-reported improvements in the traffic safety behavior of the respondents when they drive, cycle or walk in their work. Our analyses indicate that Traffic Safe Municipality can be understood as an SMS in the municipal sector, with positive consequences for traffic safety culture. Our study is unique, since we apply a theoretical perspective on safety management and safety culture that has been particularly used in high-risk organizations. Our analyzes indicate both how municipalities can influence traffic safety directly, through influencing employees' behavior in traffic at work, and indirectly through systematic work with traffic safety plans that influence the management of traffic safety in the municipality.
Declaration of competing interests
The authors declare no competing interests.
Ethics statement
The methods for data collection in the present project have been approved by the Norwegian Centre for Research Data (NSD), which assists researchers with research ethics of data gathering, data analysis, and issues of methodology. Written informed consent for participation was required for this study in accordance with the national legislation and the institutional requirements.
Availability of data
The data are available on request to the authors.