Stigson et al. | Traffic Safety Research vol. 5 (2023) 000023
How to reduce pedestrian fatalities: a case-by-case study to evaluate the potential of vehicle and road infrastructure interventions

Handling editor: Aliaksei Laureshyn, Lund University, Sweden
Reviewers: Narelle Haworth, Queensland University of Technology, Australia
Attila Borsos, Széchenyi István University, Hungary
Received: 15 November 2022; Accepted: 6 February 2023; Published: 22 February 2023
Abstract
In line with the UN’s global goals on sustainability several initiatives are promoting walking. However, if effective interventions are not implemented an increased number of pedestrians will lead to more road casualties. It is important to take appropriate decisions on interventions to reach Vision Zero adopted by the Swedish Government. This study describes the characteristics of fatal crashes with pedestrians on Swedish roads and investigates the potential of different vehicle and road infrastructure interventions to save lives. The Swedish Transport Administration (STA) in-depth database of fatal crashes was used for a case-by-case investigation. Out of the 226 fatally injured pedestrians during 2011–2016 in Sweden the most common accident scenario was a vehicle hitting a pedestrian while crossing the road. Most crashes occurred in darkness on rural roads (63%), but for urban areas the majority (53%) occurred in daylight. In general, interventions related to vehicle speed were found to address a larger proportion of the studied pedestrian fatalities on urban roads compared to on rural roads, while separated pedestrian paths outside the carriageway were found to address a larger proportion on rural roads compared to on urban roads. The intervention with the largest total potential was pedestrian crossings with speed calming measures for the motor vehicles, which had the potential to address 36% of the identified fatalities. A reduced speed limit in combination with speed calming interventions had the potential to prevent 29% of the studied fatalities while separate pedestrian paths outside the carriageway had the potential to prevent approximately 15%. It was estimated that the vehicle safety technology with the highest potential was autonomous emergency braking with pedestrian detection for passenger cars. With this system available on all cars, 58% of the studied fatalities could potentially be prevented. Most (up to 93%) of the studied fatally injured pedestrians could potentially be saved with known vehicle safety and road infrastructural technologies. However, the analysis of the potential effect of interventions show that it will take a long time until the advanced and potentially effective vehicle safety technologies will be widely spread. This shows the importance of speeding up the implementation. A fast implementation of effective interventions in the road infrastructure is also necessary, preferably using a plan for prioritization. There are two main approaches of doing that, separating road user groups, or reducing vehicle speeds in areas with mixed rod user groups to survivable levels, which is recommended to be 30 km/h. There is a need to identify areas where most pedestrian accidents occur and then use the most effective interventions. The results of this study could be helpful in this process.
Keywords
accident analysis, intervention, pedestrian injury, traffic safety
Introduction
Traffic safety is on the global agenda. Target 3.6 in the UN Sustainability Development Goals state the ambition to reduce fatalities and injuries by at least 50% by 2030 (UN, 2019). Road traffic fatalities are dominated by car occupants, but the second largest group of road user fatalities worldwide is pedestrians hit by motorised vehicles (Naci et al., 2009; WHO, 2018). In the EU, 21% of all road user fatalities are pedestrians (EC, 2019). It is estimated that 88% of the travels as pedestrians occur on roads that are unsafe (WHO, 2013). Several initiatives are promoting walking, e.g. in the UN’s global sustainability goals. If effective countermeasures are not implemented an increased number of pedestrians will lead to an increased number of road casualties. To contribute to Target 3.6 in the Sustainability Development Goal the road infrastructure needs to be designed to be safe for pedestrians.
Sweden has successfully adopted the Vision Zero program, which is a strategic approach towards a safe road transport system whereby no one is at risk of being fatally or severely injured while using it. Since 2000 pedestrian fatalities have been reduced by 65% in Sweden (ITF, 2021). Although 25 pedestrians were killed on Swedish roads in 2020 Sweden is among the safest countries for pedestrians in the EU with 2 road fatalities per 100 000 inhabitants. To reach the ambition of Vision Zero it is important to study the remaining fatalities in depth to identify effective countermeasures.
In crashes between vehicles and pedestrians, impact speed is one of the parameters with the highest influence on risk of fatality and serious injury (Rosén & Sander, 2009; Rosén et al., 2011). To prevent serious injuries and deaths among pedestrians in areas where pedestrians and vehicles are mixed in a planned and frequent manner, a maximum speed limit of 30 km/h should be applied (Stockholm_Declaration, 2020). Apart from the speed limits, the vehicle speed could be controlled and reduced by infrastructure countermeasures. Such as speed bumps and chicanes, which can successfully be used to both raise attention and to reduce speeds before entering intersections or at road sections (Agerholm et al., 2017; Lee et al., 2013; Pucher et al., 2010). Likewise, vertical or lateral shifts in the carriageway and road narrowing to a single lane or to a reduced road width have all been shown to be effective (Harvey, 1992). For rural roads physical separation in form of separated paths for pedestrians and bicyclists and safety barriers preventing non-controlled crossing have been shown to have a large potential (Kullgren et al., 2017). Furthermore, pedestrian accidents have been reduced with one third by tunnels and footbridges (Høye, 2011). However, when introducing separated paths for pedestrians and bicyclists the number of potential conflicts also increases (Jensen, 2008). Vehicle safety technology has a large potential, for example Autonomous Emergency Breaking (AEB) with pedestrian detection has been shown to reduce pedestrian collisions with 20–25% (Kullgren et al., 2022). Especially on rural roads AEB has a large potential to avoid or mitigate crashes with pedestrians and bicyclist (Kullgren et al., 2017; Kullgren et al., 2019). There is a need for stakeholders to make appropriate decisions regarding effective interventions to protect pedestrians.
The aim with this study is to describe characteristics of fatal crashes with pedestrians on Swedish roads and to calculate the potential of different effective countermeasures to save lives. The study contributes to reach the Vision Zero goal and the UN sustainability Development Goals.
Method
This case-by-case study is based on the Swedish Transport Administration (STA) in-depth database of fatal crashes within the road transport system (Vägverket, 2005). The database has restricted access and consists of police reports, medical journals, autopsy reports, and witness statements. The database also includes accident analyses performed by crash investigators at STA, who systematically inspect the vehicles involved, the crash scene and the involved road users with the aim to evaluate if and how each accident could have been prevented. In total 226 fatally injured pedestrians between 2011 and 2016 were included. Suicides and natural deaths were excluded from the data set. For each fatal crash, extracted variables include date, time, municipality, county, age, accident description, accident type, road type, accident location, crossing, speed limit measures, speed limit, line of sight, road quality, purpose of trip, traffic flow, alcohol, body region, cause of death, and vehicle type.
Descriptive analysis of pedestrian accidents
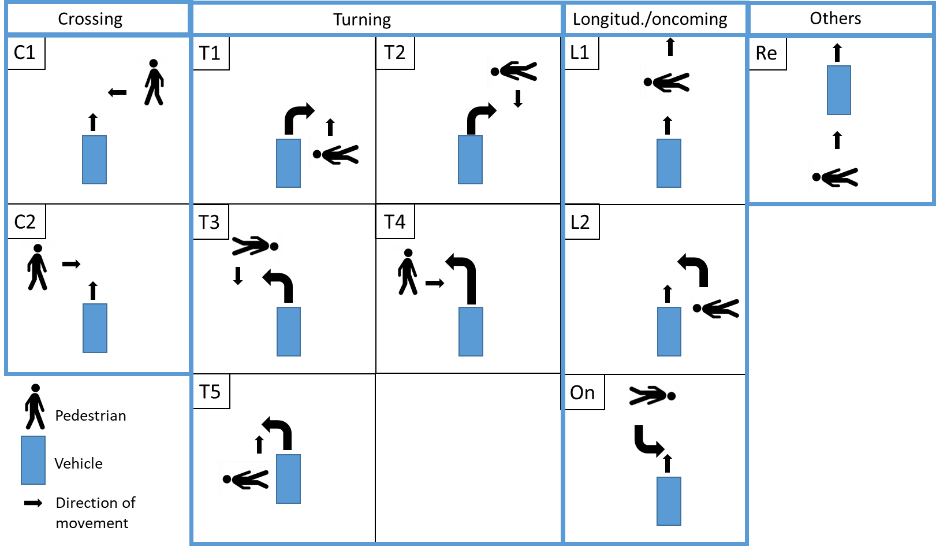
A descriptive statistical analysis including frequencies and proportions was conducted on all available variables to identify characteristics of the fatal accidents. The accident location was divided into rural and urban according to the Swedish definition. An urban area is defined as an area with houses with at least 200 inhabitants unless the distance between houses is more than 200 m. Rural area denotes a geographic area not defined as urban with low population density located outside towns and cities. The collisions were also classified and divided according to the direction of the pedestrian and the vehicle prior to the crash (Figure 1).
Projected potential of countermeasures
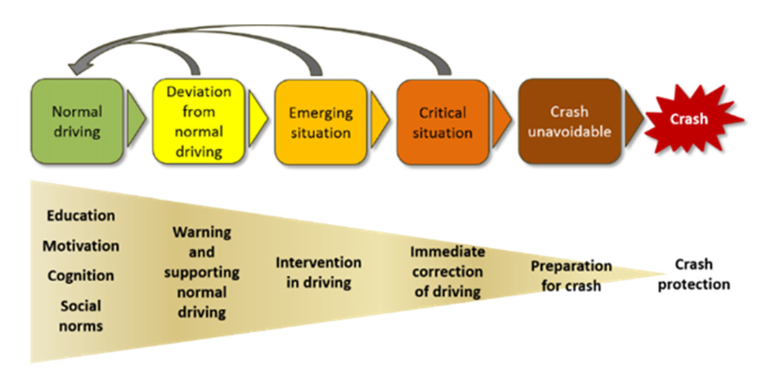
A case-by-case analysis was performed to retrospectively determine the potentials of vehicle and infrastructure safety countermeasures. The analysis considered the entire chain of events leading to the fatal crash (Figure 2). This method has previously successfully been used on different data sets (Kullgren et al., 2019; Strandroth et al., 2016; Strandroth, 2015). The method is also used by the Swedish Transport Administration to manage the Swedish national road traffic safety work and to prioritize among future interventions aimed to achieve Vision Zero.
For each crash, estimations of the potential effects of interventions were made by studying crashes from a baseline (normal) and apply assumptions regarding the effectiveness of a specific intervention. The interventions included in the analysis are listed in Appendix A. The included interventions could be considered as independent but the combined potential of the two areas was assessed without double counting (i.e. a fatality cannot be prevented twice with different interventions).
The assumptions of the potential of the infrastructure to avoid each fatality were based on previous evaluations (Elvik & Vaa, 2004) and the design principles in Vision Zero (Johansson, 2008). The road infrastructure interventions (e.g. speed management (roundabouts, speed cameras, and speed bumps), and physical separation between vehicles and unprotected road users) were analysed and assessed depending on the road width, traffic flow and other road characteristics for each of the cases. In the analysis of future potential of road infrastructure interventions, they were assumed to be implemented immediately and thereby impacting the outcome.
The future potentials of the vehicle safety technology interventions (e.g. ESC, AEB, LDW and LKA) were based on previous evaluations (Cicchino, 2016; Cicchino, 2018; Cicchino, 2022; Kullgren et al., 2022; Lie et al., 2006; Rizzi et al., 2014; Sternlund, 2017) and analysed based on the estimated prognoses on their implementation rates in the Swedish vehicle fleet (Appendix B). The model year when a close to 100% fitment rate of each safety technology in new sold vehicles was predicted by a Swedish group of experts lead by the Swedish Transport Administration (STA) including car manufacturers and senior researchers. The implementation rate of each safety technology in new sold vehicles was based on current technology development and previous implementation rates of various safety technologies in Sweden. See for example implementations rates of AEB in (Ydenius & Kullgren, 2019). For each accident, based on the model year of the vehicles involved in the fatal crashes, it was assessed whether the vehicle would be fitted with a certain safety technology in 2030 or 2050 (Appendix B). The effects of two different implementation rates were analysed, one with an expected rate (denoted normal) and the other with a five-year faster implementation rate (denoted fast).
Results
Characteristics of the fatalities
Out of the 226 fatally injured pedestrians (95 women and 131 men) 86 occurred on rural roads and 140 on urban roads (Appendix C). On urban roads an equal distribution between men and women was found, while on rural roads 70% of the fatalities were men. Half of the pedestrians (51%) were 65 years or older. Fifteen were under the age of 15, where of 7 under the age of 10. In 68% the pedestrian was hit by a passenger car, in 10% by a Heavy Goods Vehicle (HGV) and in 8% by a Light Goods Vehicle (LGV). The distribution was similar in both rural and urban areas apart from a higher proportion of crashes involving buses in urban areas (11%) compared to rural areas (3%). In urban areas the most common accident scenario was that the pedestrian was hit while crossing the road (71%), in daylight (53%), and with a posted speed limit of 50 km/h at the location of the accident. Only 10% occurred on roads with a speed limited of 30 km/h or below. In rural areas it was more likely that the pedestrian was hit while walking along the road (53%), with the majority (63%) occurring in darkness (63%), and most often with a speed limit of 70 to 90 km/h. Most of the accidents on rural roads (71%) occurred under conditions in which a combination of light, weather, and/or sight was assessed to complicate pedestrian detection by the vehicle safety sensors. On urban roads only 47% of the accidents occurred under such conditions. In 19% of the accidents the pedestrian was partly obscured by other vehicles or objects. Regarding intoxicants, 15% of the pedestrians on urban roads were under the influence of alcohol, while the corresponding figure for rural roads was 37%. Six per cent of the drivers of the hitting cars were under the influence of alcohol.
The potential of countermeasures
It was assessed that 93% of the pedestrian fatalities could be addressed and thereby have been avoided with relevant and known interventions regarding road infrastructure, vehicle safety systems, or a combination of the two (Table 1). It was assessed that road infrastructure interventions could have prevented 67% of the pedestrian fatalities and vehicle-related intervention could have prevented 80%. Seventy percent of the pedestrian fatalities on rural roads and 66% on urban roads would potentially have been prevented if relevant vehicle safety systems had been implemented in the whole vehicle fleet. For 11 (5%) of the fatalities, no known intervention could address the fatal accident (3 on rural and 8 on urban roads). Of these 11, two were hit by a motorcycle, one by a bicycle, one by a large truck, one by a bus, one by a construction vehicle, one by an unknown vehicle and four were hit by a passenger car. Among these four, one driver was under the influence of drugs and without a driving license, one was sitting on the hood of a car, one was run over by an MPV, and one was hit on a 2+1 road with the speed limit of 100 km/h.
|
Rural roads |
Urban roads |
Total |
|
|---|---|---|---|
|
(n = 86) |
(n = 140) |
(n = 226) |
|
|
Road infrastructure |
60 (70%) |
92 (66%) |
152 (67%) |
|
Vehicle |
65 (76%) |
117 (84%) |
181 (80%) |
|
Total addressed |
78 (91%) |
130 (93%) |
210 (93%) |
|
No intervention identified |
3 (3%) |
8 (6%) |
11 (5%) |
Interventions related to the road infrastructure
In general, infrastructural interventions related to speed were found to address a larger proportion of fatal accidents on urban roads compared to rural roads, while separated pedestrian paths outside the carriageway were found to address a larger proportion on rural roads compared to urban roads (see Table 2). The intervention with the largest total potential was pedestrian crossings with speed calming measures for the motor vehicles to ensure a vehicle speed below 30 km/h, which had the potential to address 49% the fatalities on urban roads and 15% on rural roads (in total 36% of the fatalities). A reduced speed limit to 30 km/h in combination with speed calming interventions had the potential to prevent 44% of the fatalities on urban road, while only 5% on rural roads (in total 29% of the fatalities). Separate pedestrian paths outside the carriageway had the potential to prevent approximately 35% of fatalities on rural roads and 17% on urban roads (in total 15% of the fatalities), see Table 2.
|
Intervention |
Rural |
Urban |
Total |
|---|---|---|---|
|
Crossing with speed calming measures |
13 (15%) |
68 (49%) |
81 (36%) |
|
Other speed calming measures, such as speed bumps and chicanes |
16 (18%) |
60 (43%) |
74 (33%) |
|
Changed speed limit (including speed calming measures) |
4 (5%) |
61 (44%) |
65 (29%) |
|
Separate path for VRUs outside the road |
30 (35%) |
5 (4%) |
35 (15%) |
|
Barrier for pedestrians |
9 (10%) |
15 (11%) |
24 (11%) |
|
Other interventions grouped |
16 (18%) |
7 (5%) |
20 (8%) |
|
Tunnel or bridge |
7 (8%) |
10 (7%) |
17 (8%) |
|
Roundabout |
4 (5%) |
11 (8%) |
15 (7%) |
|
Path for VRU on existing road |
8 (9%) |
4 (3%) |
12 (5%) |
|
TOTAL (without double counting) |
60 (70%) |
92 (66%) |
152 (67%) |
Interventions related to the vehicles
It was estimated that the vehicle safety technology with the highest potential was AEB with pedestrian detection for passenger cars (Table 3). With this system available, 63% of the fatalities on urban roads and 50% of those on rural roads could potentially be prevented. Furthermore, autonomous emergency steering system (AES) with detection of pedestrians was found to have potential to prevent 21% of the fatalities on urban roads and 57% on rural roads. Furthermore, it was assessed that especially on urban roads AEB reverse, back cameras/sensors, and side radars for heavy vehicles (trucks and buses) have the potential to prevent 11% and 9% of the fatalities on urban and rural roads respectively. However, it should be noted that no projections related to the implementation rate of these systems were made in this study.
|
Intervention |
Rural |
Urban |
Total |
|---|---|---|---|
|
AEB pedestrian |
43 (50%) |
88 (63%) |
131 (58%) |
|
AES pedestrian |
49 (57%) |
30 (21%) |
79 (35%) |
|
Combinations of systems (majority AEB+AES) |
32 (37%) |
20 (14%) |
52 (23%) |
|
AEB reverse/back camera/back sensors |
2 (2%) |
16 (11%) |
18 (8%) |
|
Side radar HGV and bus |
1 (1%) |
12 (9%) |
13 (6%) |
|
Alcolock |
6 (7%) |
3 (2%) |
9 (4%) |
|
Pedestrian airbag |
0 (0%) |
7 (5%) |
7 (3%) |
|
Run-over protection on buses |
0 (0%) |
5 (4%) |
5 (2%) |
|
Other vehicle systems (AEB city, AEB crossing, LDW, LKA, ELK, ESC, etc.) |
10 (12%) |
6 (4%) |
16 (7%) |
|
At least 12 p in Euro NCAP pedestrian test |
0 (0%) |
4 (3%) |
4 (2%) |
|
TOTAL (without double counting) |
65 (76%) |
117 (84%) |
181 (80%) |
Future potential of interventions
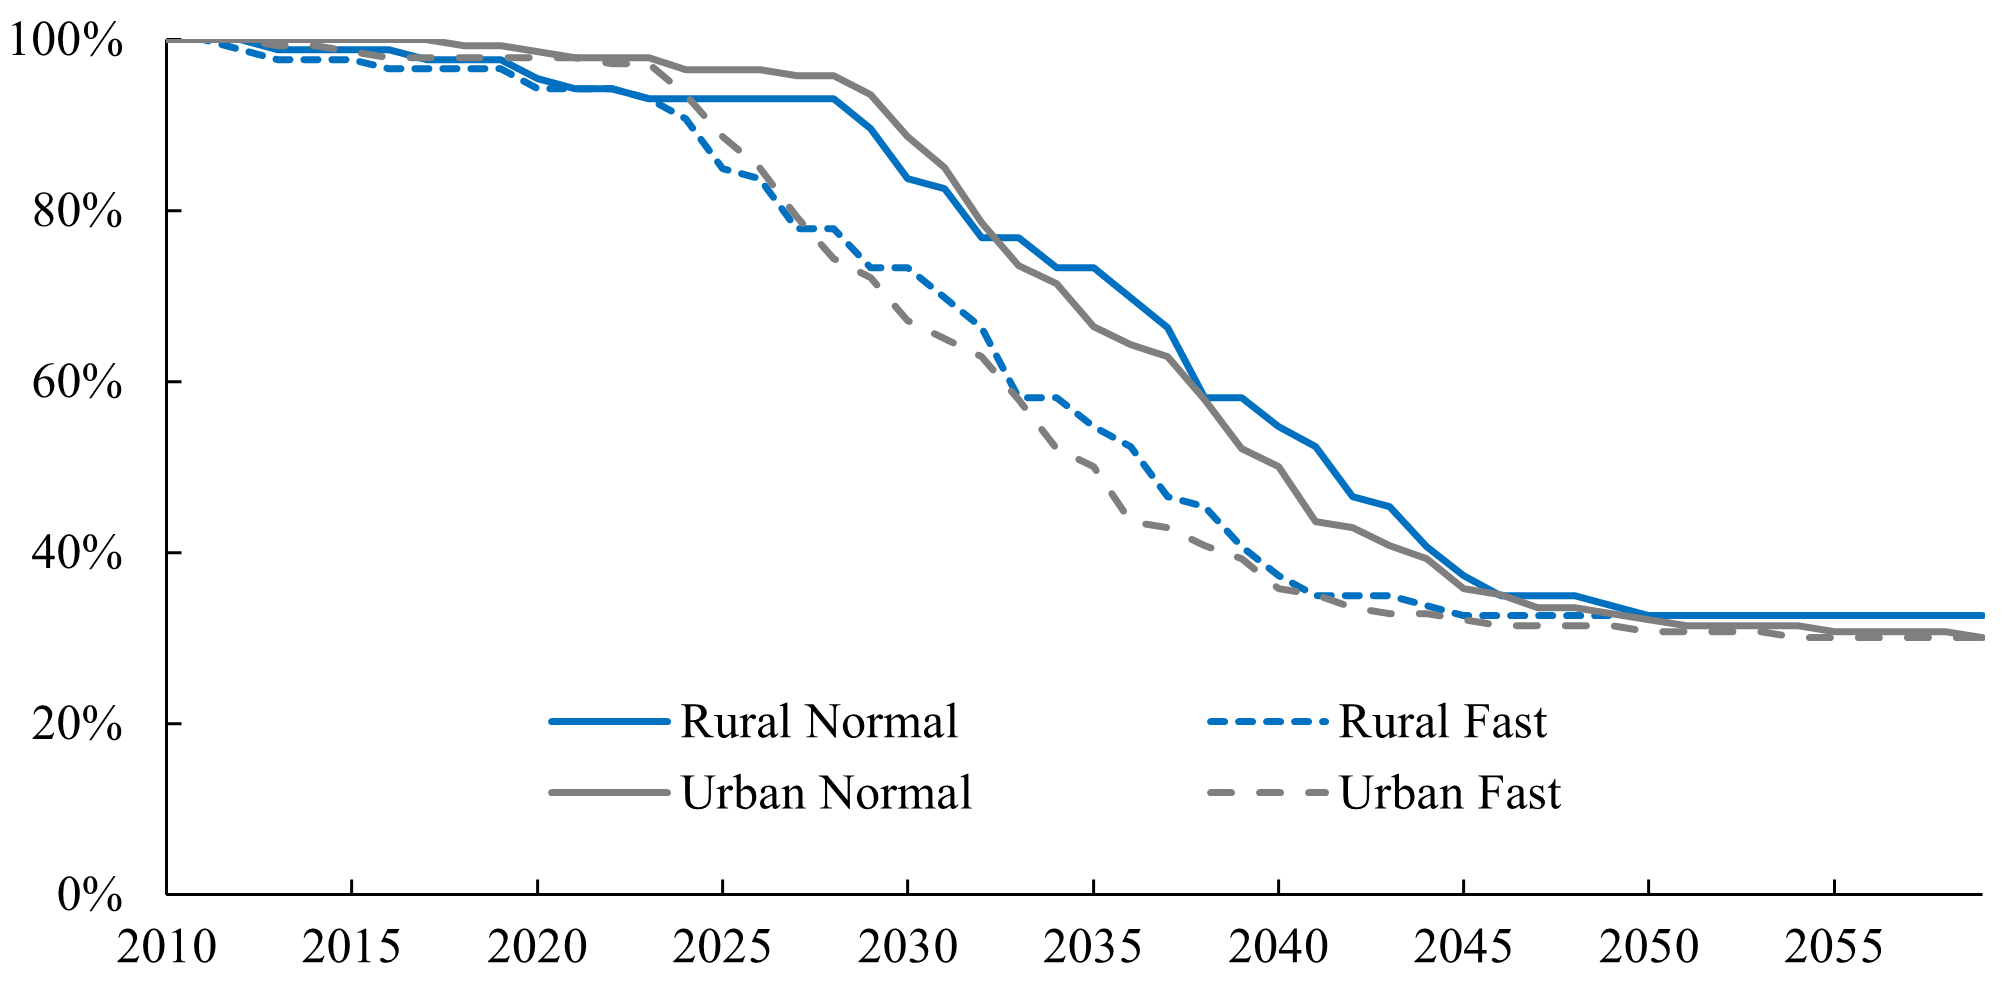
The full potential of vehicle interventions was estimated to occur far in the future (in 2050), assuming expected implementation rates (Figure 2). In 2030, between 90% and 95% of the accident population would not be addressed by the estimated improvements of the vehicle fleet according to the estimates made. An increased implementation rate (5 years faster) would mean an additional 79 saved lives on urban roads and 44 on rural roads during a 30-year period compared to the expected implementation rate (Figure 2). Expected and increased implementation rates for the various vehicle safety systems are presented in Appendix A.
Discussion
With the method used in this study it could be assessed that as many as 93% of the studied pedestrian fatalities could have been saved on Swedish roads by relevant interventions in the road infrastructure, the vehicle safety systems, or by a combination of the two. Improving traffic safety means large investments, especially for changes of the road infrastructure. The findings of this study provide road authorities and vehicle manufacturers with important recommendations for future priorities to reduce pedestrian fatalities more effectively and to assist them in fulfilling the Vision Zero and the UN global goals on sustainability (UN, 2019).
The impact of road infrastructure countermeasure
Regarding road infrastructure, two main approaches for controlling crash severity were identified; either to keep the relative velocity between road users within acceptable levels or to separate road user groups from each other. This study shows that infrastructural interventions related to the speed were found to address a large proportion of fatal accidents on urban roads, while separated pedestrian paths outside the carriageway were found to address a large proportion on rural roads. Only 10% of the fatal accidents occurred in areas with a speed limit of 30 km/h or below. A lower speed entails a higher possibility to ensure sufficient time to be able to detect a pedestrian, which means a lower risk of fatal injury (Rosén & Sander, 2009). According to recommendation #8 in 'Saving Lives Beyond 2020: The Next Steps' as well as the recommendations based on Vision Zero, the vehicle speed should be limited to 30 km/h in areas where pedestrians and vehicle co-exist (STA, 2019; Stigson & Kullgren, 2010). Several cities in Europe (e.g. Paris, Bilbao, and Brussels) have implemented 30 km/h and it will be very interesting to follow the consequences of these implementations. The present study also shows that many fatalities occurred in crossings, highlighting the need for controlling and reducing the speed in crossings or to implement level crossings. Previous studies have shown that for example speed bumps are effective (Agerholm et al., 2017; Lee et al., 2013; Naci et al., 2009; Pucher et al., 2010). In the present study no accidents occurred on a road with speed reducing interventions. It was also identified that the intervention with the largest total preventive potential was pedestrian crossings with speed calming measures for the motor vehicles. Several studies have shown that there is an increased risk for serious and fatal injury for pedestrians above 60 years age (Rosén et al., 2011; Stigson & Kullgren, 2010). The result from this study show that half of the pedestrian fatalities were above 65 years age. Both the road network and the road environment need to be designed to ensure the safety for this age category. To Achieving equality in the transportation systems is also recognized in the UN sustainability goals. Another risk group identified was pedestrians 18 years or younger in or on their way to school (22 of the 226). The public and private sectors have an important role to increase their safety and this role is highlighted in recommendation #4 in ‘Saving Lives Beyond 2020: The Next Steps’, in which they are suggested to ensure that children have a safe road environment that enables them to walk and ride a bicycle.
The impact of vehicle safety technology countermeasures
In addition to changes in the road infrastructure, improvements of the vehicle fleet to protect pedestrians will be very important. Recent studies show that existing AEB aimed for pedestrians only has a 20–25% crash reduction, and no reduction in darkness (Cicchino, 2022; Kullgren et al., 2022). It is in the present study assumed that AEB for vulnerable road will have a large positive effect for avoiding or mitigating pedestrian fatalities. With this system available, 63% of the pedestrian fatalities on urban roads and 50% of those on rural roads could potentially be prevented. However, it was identified that the full potential for vehicle interventions would not occur until many years ahead, not until 2050 with the current expected implementation rates of vehicle safety technologies. In Sweden the average lifetime of vehicles is approximately 18 years, that entails a slow implementation rate. In this study the average age of the vehicles in collision with pedestrians was approximately 10 years. Actions aimed to speed up the implementation rate are required to reach the 2030 sustainability goals. Vehicle procurement policies can be an effective tool to increase the implementation rate. It was estimated that in 2021, 58% of all new vehicles in Sweden were purchased by a business in private or public sector. A recent study shows that it is more common to include environmental requirements than safety requirements in procurement policies (Klingegård et al., 2022).
It was found that most of the accidents on rural roads (71%) and about half on urban roads (47%) occurred under conditions in which a combination of light, weather, and/or sight distance would complicate the detection of the pedestrian by the vehicle safety sensors. In approximately one out of five accidents (19%) the pedestrian was partly obscured by other vehicles or objects, which highlights current design challenges for AEB systems. Since 2018 Euro NCAPs test protocol cover tests of AEB in darkness and with an obscured view. However, studies of real-world pedestrian collisions clearly show that the AEB systems need to be improved, especially in darkness (Cicchino, 2022; Kullgren et al., 2022). With the current performance of pedestrian AEB many of the accidents would be difficult to mitigate.
Methodological considerations
For each accident, predictions were made whether the accident would lead to a fatality if it occurred in 2030 or 2050. The predictive methodology has successfully been used in previous studies (Kullgren et al., 2017; Strandroth et al., 2012). Fatal accidents that were estimated to be avoided by 2030 or 2050 were removed from the accident sample for the next step, thus providing a population of future crashes that will require further actions. However, there are some limitations with this method.
The study included all fatal crashes with pedestrians in Sweden that occurred during the sampling period (except suicides). The study does not cover serious injuries. Further research should be performed regarding the protection of pedestrians sustaining serious injuries. Preventive interventions aimed for serious injury could differ from those aimed for fatalities. It could also be the case that an avoided fatality will lead to a serious injury. This should also be studied further.
If each fatally injured pedestrian, especially older ones, could have used other transport modes was not considered. Each pedestrian was assumed to still be a pedestrian. Also, the age of the pedestrian was not considered as a factor in the analysis (e.g., there may be a difference in effectiveness of interventions dependent on age group (children vs. adults).
Moreover, the method does not account for the influence of changes of post-crash interventions, such as rescue, hospital care, and rehabilitation on fatality outcomes. It was assumed that rescue, emergency care and rehabilitation would have the same standard in Sweden during the analysis period. Furthermore, it is difficult to account for future trends which may impact the prognoses made in this study. For instance, it is predicted that geo-fencing could have large impact but there is no data so far that can be used to account for the effect of this technology. Other measures such as pedestrian use of reflective material (Lahrmann et al., 2018) and use of illuminated crossings (Høye & Elvik, 2012) have not been included as it to date is difficult to estimate their effects. In the analysis of the future potential, it was assumed that changes to the infrastructure was introduced immediately because implementations rates could not be assessed for these interventions. However, the implementation of these will take long time. And it should be noted that a systematic implementation of the analysed countermeasures of the whole road network is necessary to achieve the safety potentials shown in the present paper.
While the material used was fully representative for Swedish conditions, in such retrospective studies it may be difficult to consider the possible behavioural adaption that could follow the implementation of certain countermeasures. The results apply to Swedish conditions as is based on the current infrastructure and vehicle fleet in Sweden and also the expected developments in Sweden. For example, differences in implementation rates within European countries have been seen. However, recent EU directives have made the differences smaller over the years. One should therefore be careful to generalize the results and proposed interventions to other countries.
Conclusions
Most (up to 93%) of the studied fatally injured pedestrians could potentially be saved with the implementation of known vehicle safety systems and changes of the road infrastructure known to be able to address the fatal accidents studied. However, the analysis of the potential effect show that it will take a long time until the advanced and potentially effective vehicle safety technologies will be widely spread. This shows the importance of speeding up the implementation rate. A fast introduction of effective interventions in the road infrastructure is also necessary, preferably using a plan for prioritization. There are two main approaches of doing that, separating road user groups, or reducing vehicle speeds in areas with mixed road user groups to survivable levels, which is recommended to be 30 km/h. There is a need to identify areas where most pedestrian accidents occur and then use the most effective interventions. The results of this study could be helpful in this process.
Declaration of competing interests
The authors report no competing interests.