Investigating factors that affect traffic conflicts between bicyclists and right turning vehicles at signalized intersections
Handling editor: Nicolas Saunier, Polytechnique Montreal, Canada
Reviewers: Narelle Haworth, Queensland University of Technology, Australia
Anja Huemer, Universität der Bundeswehr München, Germany
Alyssa Ryan, University of Arizona, the United States of America
Received: 27 October 2022; Accepted: 11 December 2023; Published: 22 January 2024
Abstract
There is increasing interest in designing infrastructure systems to promote the safe use of forms of active transportation such as bicycling. Collision data, which are typically used in road safety studies, may be incomplete and the use of such data is reactive as it requires collisions to have already taken place. As such, alternative approaches for evaluating the safety effect of various infrastructure attributes, such as the use of surrogate safety measures, specifically traffic conflicts, are becoming popular. Most collisions between bicyclists and vehicles occur at intersections and, of these, collisions between right turning vehicles and bicyclists form the majority. The main objective of this study was to use cross-sectional regression models to investigate various intersection characteristics, including geometry, signal phasing, and bicycle infrastructure, to determine which attributes are significantly associated with right turning conflicts and how this may vary with different conflict severity levels. An increase in right hook vehicle-bicycle conflicts was found to be associated with the presence of a dedicated right turn lane on the left of a bicycle lane, having a downgrade on the approach to an intersection, the absence of pavement markings, a decrease in the value of lateral offset, and an increase in bicycle and right turning vehicle volume.
Keywords
bicyclists, cross-sectional regression models, intersection safety, right hook conflicts, safety countermeasures, surrogate measures of safety
Introduction
Active transportation has been recognized to have benefits to public health and safety, the environment, and the economy (Government of Canada, 2022). Cycling is a principal form of active transportation, but bicyclists are among the most vulnerable of road users as they do not have the protection offered by a vehicle and its various safety features such as seatbelts. Statistics Canada indicates that collisions with a motor vehicle made up 73% of fatal bicycling events between 2006 and 2017 (Statistics Canada, 2019). It is therefore not surprising that they are a key part of the demographic being targeted by Toronto's Vision Zero plan which pledges to improve safety using a data-driven approach (City of Toronto, 2022).
Road safety analysis typically uses collision data to develop models to predict the number of collisions at a location of interest based on various attributes such as signalization options, intersection geometry and exposure. Lack of bicycle volume data is a possible impediment to such studies; however, computer vision technology allowed for the bicycle volumes to be measured directly in this research. Another obstacle is that collision data, which are typically obtained from police records, may be incomplete due to unreported collisions. Additionally, collisions between bicyclists and vehicles are much less frequent than those between vehicles, resulting in inadequate sample sizes for meaningful analysis. Surrogate safety measures, such as traffic conflicts, provide an alternative to collisions as a measure of safety. Conflicts are non-collision interactions between road users defined by a threshold value of a specific surrogate safety measure. The use of surrogate safety measures to develop models that correlate to collisions is an area of increasing interest and has shown promising results (Anarkooli et al., 2021; Chen et al., 2017; Lorion, 2014).
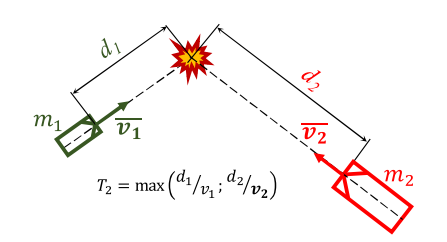
Two surrogate safety measures that are commonly used for evaluating safety at an intersection are time to collision (TTC) and post-encroachment time (PET) (Chen et al., 2017). TTC is the time until a collision would occur between two or more road users that approach each other in space and time to such an extent that a collision is imminent if their movements are not altered. PET is the time between one road user leaving a conflict zone and another road user arriving at the same conflict zone. In this study, a modified time to collision (T2) surrogate safety measure was used to identify conflicts. T2 is a continuous indicator that is calculated once trajectories of two road users converge on a conflict area. It is defined as the time for the latter of the two to arrive at a conflict area. It is a generalized and flexible temporal proximity measure, for which PET and TTC are two unique cases. It accounts for possible changes in speed and travel path leading up to an interaction (Laureshyn et al., 2017). Computing TTC and T2 requires motion prediction, for which there are diverse methods; for this research, constant velocity was used for motion prediction. A simplified illustration of the T2 concept is shown in Figure 1.
Recent studies have used video analytics to identify conflicts based on some threshold value of a surrogate safety measure. In a case-control study (Zangenehpour et al., 2016) to determine if bicycle tracks improve bicycle safety at signalized intersections, video analytics software was used to identify interactions between bicyclists and turning vehicles. That study detailed the method by which video analytics software was able to identify different road users, i.e., pedestrians, bicyclists, or vehicles, to develop trajectories for these road users and to identify trajectories for bicyclists and vehicles that intersect. PET was the surrogate safety measure used in the study and details of how video analytics was used to determine this value were explained.
Studies have been done to analyze which factors, such as bicycle infrastructure, exposure, environmental factors, and other such variables, may influence bicycle safety both on segments and at intersections. In a recent study, it was found that most collisions occur at intersections (Bassil et al., 2015). Right turning vehicle movement was found to have a significant effect on the number of bicyclists injured at an intersection, more so than for any other direction of traffic movement (Miranda-Moreno et al., 2011).
The results of previous studies were mixed with respect to the safety effects of the bicycle facilities (Liu & Marker, 2020). A suggested explanation for the uncertainty related to the safety effects of bicycle facilities is that it depends on the context into which they are introduced (Phillips et al., 2011). For example, it may take some time for drivers to adapt to bicycle infrastructure so the effects of a bicycle facility may be different 2 months after implementation in comparison to 4 years after. Additionally, populations of different countries may have more experience with certain bicycle facilities than others and may respond differently. A review of published literature that mainly pertained to controlled before and after studies did not find any conclusive evidence that bicycle lanes and other such cycling infrastructure reduces cycling injuries (Mulvaney et al., 2015). However, it should be noted that most of the studies reviewed did not use modern techniques that accounted for regression to the mean and controlled effectively for other non-treatment effects. In addition, sample sizes could be too small, as notes by Strauss et al. (2013) who did not find any statistically significant results in relation to the effect of bicycle infrastructure on bicyclist safety. A recent study Milligan et al. (2022) looked at advancing design practices to mitigate bicycle right-hook conflicts and considered how intersection characteristics affect both the speed of right turning vehicles and the conflicts between right turning vehicles and bicyclists. This study identified several factors that were associated with conflict frequency such as the presence of a right turning lane, the lateral offset of the bicycle facility as measured between the extension of the outside edge of the vehicle lane (for the right turning vehicle movement analysed) to the edge of the travel path for cyclists through the intersection, the total length of bicycle exposure to right turning vehicles, starting at the vehicle stop bar and ending at the furthest edge of the furthest vehicle receiving lane, and the grade on approach to the intersection.
Data overview
Signalized intersection approach characteristics and conflict data from 10 different cities in 7 different Canadian provinces and territories were provided by Miovision, a company specializing in video conflict analysis for road safety. Each city used their own criteria when selecting the intersections to be analyzed. Some of these criteria included having higher than normal cyclist volume, the presence of new cycling infrastructure, having a specific intersection design such as protected corners, having high right turning vehicle volume, and a history of past collisions. Conflict data were collected during different months of the year, between July and December. Bicycle volume, and right turning vehicle volume were counted in 15-minute intervals on a single day during the week. The time over which the counts were done mostly corresponded with the time over which the conflict analysis was done. The conflict analysis period varied from intersection to intersection; therefore, a standard method of estimating the right turning vehicle volume and bicycle volume had to be established. This is explained in greater detail in section 3 Methods. Intersections where conflict analysis and/or bicycle and vehicle counts were not observed approximately during the same times were removed from the database. The database was also filtered by presence of signalization for reasons explained further in section 3 Methods. After filtering the data, 65 intersection approaches were used to generate the final models provided in this study. In a few cases, multiple approaches from a single intersection were used. Various intersection approach characteristics were needed to facilitate the statistical analysis. These properties were mainly grouped as follows:
-
bicycle facility type
-
signalization
-
geometry
-
traffic.
Facility type and geometry data were collected using Google Maps 1 in combination with drawings provided by the cities and observations from the video files. Information on the type of signalization present at the different intersection legs was obtained from signal timing plans provided by the cities or from observing the traffic flow on video files obtained from the cameras set up at the intersections. The volume of the right turning vehicles and the volume of bicyclists crossing the intersection leg in conflict with those right turning vehicles were obtained using data from video files.
Miovision also provided information for each conflict observed, including the modified time to collision (T2) value and the speed of the vehicle in conflict with the bicyclist. These values were used to filter the conflicts into various severity levels.
Hyden (1987) noted that conflicts with TTC values above approximately 3 seconds were difficult to detect as they were part of the common interaction pattern at the intersection.De Ceunynck (2017) reviewed various publications relating to traffic conflicts and found that threshold values of 1.5 s, 2 s and 3 s are the most commonly used for TTC. These values were related to conflicts between vehicles and are not specific to conflicts involving a vehicle and bicyclist; however, they were still used as a guide in this study. As a result, a threshold value of 3 seconds for the modified time to collision (T2) was used to identify a conflict. These conflicts would later be filtered into different severity levels. Based on this threshold value, the total conflicts observed at each intersection were determined using the video analytics software. The software used was able to differentiate between bicyclists, pedestrians and vehicles; however, the software does not provide further classifications such as cars, buses, trucks etc. Table 1 provides summary statistics of the data for the 65 intersection approaches used in the generation of the models created in this study.
|
Parameter |
Frequency |
Mean |
Min |
Max |
St. Dev |
|---|---|---|---|---|---|
|
Daily right hook conflicts |
n/a* |
3.48 |
0 |
17.20 |
4.28 |
|
Right turning vehicle volume |
n/a |
1036 |
88 |
6313 |
1068.4 |
|
Bicycle volume |
n/a |
341 |
10 |
1771 |
419.6 |
|
Bicycle exposure length/m |
n/a |
12.18 |
4.5 |
25 |
3.83 |
|
Advanced stop line/m |
n/a |
2.21 |
0 |
10.1 |
2.96 |
|
Lateral offset/m |
n/a |
1.12 |
0 |
5 |
1.42 |
|
Average right turn motor vehicle speed/(km/h) |
n/a |
17.67 |
11 |
26 |
3.71 |
|
Downgrade on approach to the intersection |
16 |
n/a |
n/a |
n/a |
n/a |
|
Pavement markings present |
35 |
n/a |
n/a |
n/a |
n/a |
|
Constant or increasing lateral offset on approach |
55 |
n/a |
n/a |
n/a |
n/a |
|
Having a dedicated right turn lane |
26 |
n/a |
n/a |
n/a |
n/a |
|
Right turn on red permitted |
58 |
n/a |
n/a |
n/a |
n/a |
* n/a indicates ‘not applicable’
Methods
Conflict prediction models were developed using the SAS software (SAS, 2019) to link independent variables to different dependent variables by a log function whereby the independent variables were assumed to be linked to the transformed dependent variable in a linear manner, resulting in a log-linear relationship. A negative binomial error (NB) structure, which is accepted as more appropriate for collision data (which are correlated to conflicts) than one based on the normal distribution, was assumed. The NB distribution also has advantages over a Poisson distribution that is sometimes considered in that it allows for overdispersion that is common in collision data (Gross et al., 2018). The number of conflicts at a specific severity level was used as the dependent variable in the models.
The models generated are all of the form shown in Equation 1:
where Conflicts is the total number of conflicts at a specific severity level observed during the 12-hour analysis period (typically from 7:00 to 19:00);
is the estimate of the constant in the linearized regression model;
are coefficients estimated in the regression analysis;
BV is the total estimated bicycle volume over the 12-hour conflict analysis period;
RTVV is the total estimated right turning vehicle volume over the 12-hour conflict analysis period;
represent various independent variables for final inclusion in the model, depending on the statistical significance of their coefficients in the regression analysis.
The conflict analysis period for most of the intersections in the study was from 7:00–19:00, with occasional severe weather and other factors contributing to some variations in this analysis timeframe at certain intersections. This 12-hour timeframe was used to standardize the count data, and the total right turning vehicle volume and bicycle volume on a particular day were observed from 7:00–19:00 at each intersection. These 12-hour counts were used in the generation of the conflict prediction models. Intersections in the database also had different conflict analysis periods due to some being observed for more days than others; for example, one intersection may have had a conflict analysis period of 60 hours spread across 4 days while other intersections may have had a conflict analysis period of 50 hours spread across 3 days. To cater for this variation in analysis periods, the number of days was used as an offset variable in the regression model with the number of days being calculated as the total analysis period divided by 12 hours. As a result, models that predict conflict frequency over a 12 hour period were generated, with this 12 hour period typically being 7:00–19:00.
The conflict severity levels were defined by combinations of different ranges of the T2 variable and the conflicting vehicle's speed. Hyden (1987) found that classifying conflict severity by both a temporal measure (time-to-collision) and speed was more stable than classifying conflict severity by a temporal measure alone. The modified time to collision was chosen as the temporal surrogate safety measure as it can cater for both collision course and non-collision course interactions. Using a 3 second threshold value, the video analytics software was able to identify conflicts from video files based on the procedure outlined below:
-
Videos recordings were collected at intersections using temporary or permanently deployed cameras.
-
The video analytics software automatically detected and classified road users in every frame of the video using artificial intelligence/ computer vision models.
-
A tracking algorithm linked together the road user detections in adjacent frames of the video to create tracks.
-
Spatial mapping through homography was completed to map the location of a road user from the image coordinate into the world coordinate at the intersection. This required undistorting the images and developing a relationship between pixel coordinates and world coordinates.
-
Trajectories for every road user were developed in world coordinates and intersecting trajectories were filtered based on the criteria used to define a conflict.
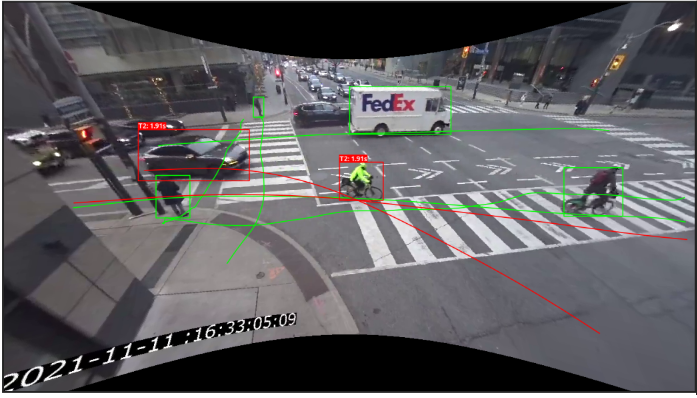
Each conflict identified in the database is between a cyclist and a right turning vehicle, based on their intersecting trajectories as explained above. The presence of other road users, such as pedestrians or other bicyclists, and any effect they may have had on the conflict was not considered in this study.
Figure 2 shows an image of the video analytics software examining a video file, detecting road users, and creating trajectories.
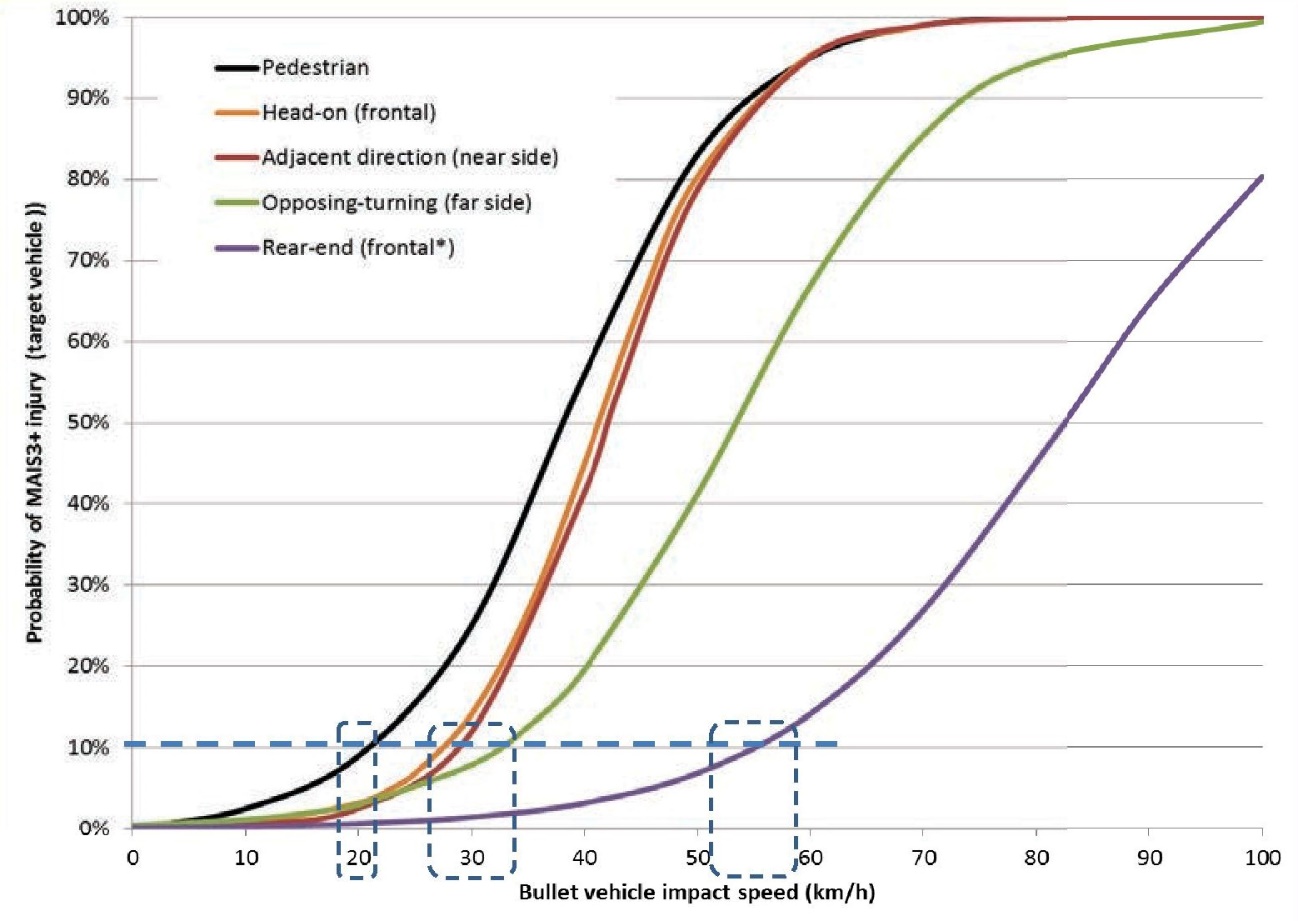
A conflicting motor vehicle speed of 15 km/h (in combination with other values of the modified time to collision metric) was chosen for this research as an experimental threshold value to classify the conflicts into different severity levels. This is based on research in relation to the probability of a severe injury (Maximum Abbreviated Injury Score of more than 3, MAIS3+) for a pedestrian (Jurewicz et al., 2016). The probabilities developed for pedestrians (Jurewicz et al., 2016) were applied to bicyclists in this study, although there may be some differences between the two types of vulnerable road users. The severity of conflicts between vehicles and bicyclists was based on different threshold values for the probability of a MAIS3+ injury to pedestrians as shown in Table 2. These threshold values, though logical, are still pending validation through correlations to collisions, a task that was outside the scope of this study. There were no conflict speeds in the dataset corresponding to high severity conflicts, therefore, the conflicts could only be further classified as either medium or low conflicts based on a 5% probability for a MAIS3+ injury. Based on Figure 3 this corresponds to a conflict speed of 15 km/h.
|
Severity |
Probability of MAIS3+ injury |
Speed threshold for VRU |
|---|---|---|
|
Low |
< 5% |
< 15 km/h |
|
Medium |
5%–40% |
15–35 km/h |
|
High |
> 40% |
> 35 km/h |
The conflict severity levels for which models were developed were classified as follows:
-
Total conflicts
-
Conflicts with conflict speed > 15 km/h
-
Conflicts with conflict speed < 15 km/h
-
Conflicts with T2 < 2 s and conflict speed > 15 km/h
-
Conflicts with T2 < 2 s and conflict speed < 15 km/h
-
Conflicts with 2 s < T2 < 2.5 s and conflict speed > 15 km/h
-
Conflicts with 2 s < T2 < 2.5 s and conflict speed < 15 km/h
-
Conflicts with 2.5 s < T2 < 3 s and conflict speed > 15 km/h
-
Conflicts with 2.5 s < T2 < 3 s and conflict speed < 15 km/h.
Although the above thresholds have a basis in injury biomechanics research, future additional validation of conflict severity levels by linking them to collision frequency over long periods would be beneficial.
It should be noted that the dependent variable for each of the 9 models is different, and so the models are not comparable in a statistical sense.
Before the final models were developed, the data were filtered so that only those intersections with permissive vehicle right turn signalization were included in the regression analysis. This was done because signalization was found to have a significant influence on the number of conflicts at the intersection. Analyzing intersections with permissive signalization only ensured that the effects of signalization were the same across all intersections.
Table 3 shows the parameters of a regression model of the form shown in Equation 1, which was generated from the database before it was filtered by signalization. Most of the signal phasing strategies have a significant effect on the frequency of conflicts between bicyclists and right turning vehicles. Fully protected phasing was seen to be associated with a reduction in the frequency of conflicts, as would be expected. Although different regression models were formulated using the entire dataset, including signalization as an explanatory variable did not provide much insight into what other factors might also be contributing to the conflict frequency as many of the parameters included in the final models (from the filtered database) were insignificant in the earlier models.
|
Parameter |
Coefficient |
p value |
|---|---|---|
|
Intercept |
-9.3349 |
< 0.0001 |
|
Ln total right turn volume |
0.8048 |
< 0.0001 |
|
Ln total bicycle volume |
0.7939 |
< 0.0001 |
|
Leading bicycle interval length* |
-0.2508 |
0.0057 |
|
Fully protected phasing |
-2.8242 |
< 0.0001 |
|
Leading bicycle interval/permissive |
1.0431 |
0.0613 |
|
Protected right turn/permissive |
-0.1713 |
0.7003 |
|
Permissive |
|
|
|
Dispersion |
0.2887 |
|
* Leading bike interval (LBI) refers to the time allotted to bicyclists to cross before motor vehicles are allowed to enter the intersection.
Results
Multiple models were estimated on the filtered dataset, as described earlier, one for each conflict severity level previously identified. The results of the regression analysis are summarized in Table 4. ‘NA’ in Table 4 signifies that the parameter was not included in the model since it was not found to be statistically significant, while the dashes indicate that a variable was not included in a model. The conflicts used for the dependent variables are identified in a footnote to the table. The formulation for these models is given in Equation 1.
The following shows an example of model 1, generated from the regression analysis for total conflicts over the 12-hour conflict analysis period:
where BV—bicycle volume;
RTVV—right turn vehicle volume;
BEL—bike exposure length;
ASL—advance stop length;
LatOffset—constant or increasing lateral offset;
DRTL—dedicated right turn lane;
Approach—flat or uphill approach to intersection;
NoPMP—no pavement markings present.
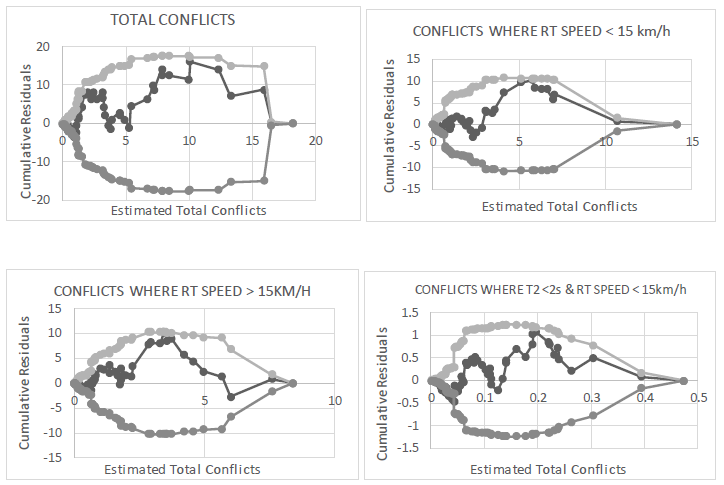
It is important to determine how models perform over the range of values for different variables in the model. A model may be accurate at predicting conflicts on average but may still over predict or underpredict over specific ranges of a variable. To determine how the models perform over a range of values, Cumulative Residual (CURE) plots are useful (Hauer & Bamfo, 1997). CURE plots are created by plotting the cumulative residuals arranged in ascending order of the values of a particular variable. Hauer (2015) has suggested that the most informative abscissa is the estimate of the dependent variable from the model. The 95% confidence limits are plotted on the same axis along with the cumulative residuals. If there is no bias present in the model, the CURE plot would oscillate consistently within the confidence limits. If the CURE plot increases continuously over a specific range of values, it indicates that the model underpredicts in that range. Alternatively, if the CURE plot decreases continuously over a specific range of values, it indicates that the model overpredicts in that range. If there is a steep vertical change slope in the cure plot, this might indicate the presence of an outlier in the data (Hauer, 2015). A prediction model can be considered to be calibrated well over the entire range of the data if no more than five percent of the CURE plot ordinates exceed the 2σ limits (Lyon et al., 2016). These limits represent the 95% confidence intervals for the n residuals corresponding to the first n estimated values of the total number of conflicts.
Figure 4 shows illustrative CURE plots for some of the daily conflict prediction models generated. Based on the suggestion by Hauer (2015) the cumulative residuals were plotted in ascending order of the model estimated conflicts. As can be seen from these plots, the models are calibrated well to the data based on the criteria stipulated in Lyon et al. (2016). A similar observation could be made for the other models based on CURE plots that are not shown here.
|
Parameter |
Model 1 |
Model 2 |
Model 3** |
Model 4 |
Model 5 |
Model 6 |
Model 7 |
Model 8 |
Model 9 |
|||||||||
|---|---|---|---|---|---|---|---|---|---|---|---|---|---|---|---|---|---|---|
|
Est. |
p |
Est. |
p |
Est. |
p |
Est. |
p |
Est. |
p |
Est. |
p |
Est. |
p |
Est. |
p |
Est. |
p |
|
|
Intercept |
-11.09 |
.000 |
-13.77 |
.000 |
-10.01 |
.000 |
-13.29 |
.000 |
-8.40 |
.000 |
-14.75 |
.000 |
-11.64 |
.000 |
-15.11 |
.000 |
-12.92 |
.000 |
|
No downgrade on intersection approach |
-.30 |
.104 |
-.59 |
.037 |
-.31 |
.160 |
-1.43 |
.000 |
-.90 |
.040 |
- |
- |
- |
- |
- |
- |
- |
- |
|
No pavement markings |
.61 |
.001 |
.62 |
.030 |
.61 |
.014 |
.65 |
.117 |
- |
- |
0.50 |
.092 |
- |
- |
.86 |
.023 |
.79 |
.005 |
|
Constant or increasing lateral offset on approach |
.58 |
.013 |
.98 |
.003 |
.34 |
.214 |
.95 |
.052 |
- |
- |
0.93 |
.008 |
- |
- |
1.01 |
.020 |
- |
- |
|
Ddicated right turn lane |
.35 |
.032 |
.79 |
.001 |
- |
- |
.76 |
.046 |
- |
- |
0.54 |
.034 |
- |
- |
.90 |
.005 |
- |
- |
|
Right turning vehicle volume |
.64 |
.000 |
.42 |
.004 |
.74 |
.000 |
.25 |
.249* |
.45 |
.091 |
0.41 |
.013 |
.72 |
.001 |
.40 |
.041 |
.85 |
.000 |
|
Bicycle volume |
1.15 |
.000 |
1.37 |
.000 |
1.03 |
.000 |
1.31 |
.000 |
.75 |
.000 |
1.31 |
.000 |
1.05 |
.000 |
1.41 |
.000 |
1.23 |
.000 |
|
Bicycle exposure length*** |
.05 |
.025 |
- |
- |
- |
- |
- |
- |
- |
- |
- |
- |
- |
- |
- |
- |
- |
- |
|
Advanced stop line**** |
.05 |
.106 |
.08 |
.068 |
- |
- |
- |
- |
- |
- |
- |
- |
- |
- |
- |
- |
- |
- |
|
Lateral offset |
- |
- |
-.21 |
.035 |
-.96 |
.052 |
-.39 |
.036 |
-.58 |
.032 |
- |
- |
-.25 |
.078 |
- |
- |
.11 |
.171 |
|
Lateral offset x Ln (bicycle volume) |
- |
- |
- |
- |
.16 |
.070 |
- |
- |
- |
- |
- |
- |
- |
- |
- |
- |
- |
- |
|
Average right turn motor vehicle speed |
- |
- |
.14 |
.001 |
- |
- |
.15 |
.004 |
- |
- |
0.15 |
.000 |
- |
- |
.14 |
.008 |
- |
- |
|
No right turn on red |
- |
- |
- |
- |
- |
- |
- |
- |
- |
- |
- |
- |
- |
- |
-1.23 |
.022 |
- |
- |
* The models in the table are for the conflict levels defined as: 1. Total conflicts; 2. Conflicts with conflict speed > 15 km/h; 3. Conflicts with conflict speed < 15 km/h; 4. Conflicts with T2 < 2 s and conflict speed > 15 km/h; 5. Conflicts with T2 < 2 s and conflict speed < 15 km/h; 6. Conflicts with 2 s < T2 < 2.5 s and conflict speed > 15 km/h; 7. Conflicts with 2 s < T2 < 2.5 s and conflict speed > 15 km/h; 8. Conflicts with 2.5 s < T2 < 3 s and conflict speed > 15 km/h; 9. Conflicts with 2.5 s < T2 < 3 s and conflict speed < 15 km/h.
** Model 3 is the only model where the bicycle facility types were noted to be at least at a 10% significance level. The estimates and p values were as follows: Bi-directional cycle path: -0.94 (.021), Painted Bike Lane: -0.60 (.097), Protected Bi-directional bicycle lane: -0.62 (.104), Protected Uni-directional bicycle lane -0.5779 (.075), Shared-use path: Baseline.
*** Total length of cyclist exposure to right turning vehicles. The measurement starts at the vehicle stop bar, except for multi-use paths where it would start at the gutter line or a protected bike lane where the barrier extends past the stop bar, in which case the measurement would start where the barrier ends. The measurement extends as far as the furthest edge of the furthest receiving travel lane.
**** Advanced Stop Line: Longitudinal distance between the bicycle lane stop bar and adjacent vehicle travel lane stop bar.
A quantitative analysis of the effects of changing different variables was done for each conflict severity level, i.e., for each model. To determine the effect of a change to a categorical variable, the number of conflicts predicted by a model equation corresponding to a severity level was calculated for the baseline level of that categorical variable. The values of the other variables in the model equation were selected using typical values for those variables present in the dataset. After this was done, the number of conflicts predicted by the model equation corresponding to a given severity level was calculated using the same values for the other variables as before using, however, a different level of the categorical variable. The percentage change in the number of conflicts predicted, compared to the number of conflicts predicted for the baseline level of the categorical variable was then calculated and is presented in Table 5.
This calculation (percentage change in estimated conflicts) can be represented by Equation 3:
where —the estimate of the coefficient of the categorical variable, at the level of that categorical variable for which the change in categorical variable from the baseline level is being analyzed.
The results of these effects for each conflict severity level are presented in Table 5.
|
Parameter |
Average associated effect on conflicts** |
||||||||
|---|---|---|---|---|---|---|---|---|---|
|
Model 1 |
Model 2 |
Model 3 |
Model 4 |
Model 5 |
Model 6 |
Model 7 |
Model 8 |
Model 9 |
|
|
No downgrade on intersection approach |
-26.2% |
-44.7% |
-26.6% |
-76.0% |
-59.4% |
NA |
NA |
NA |
NA |
|
No pavement markings |
84.5% |
86.9% |
84.7% |
92.3% |
NA |
64.5% |
NA |
137.0% |
120.1% |
|
Constant or increasing lateral offset on approach |
78.6% |
167.2% |
40.7% |
158.4% |
NA |
153.3% |
NA |
173.3% |
NA |
|
Dedicated right turn lane*** |
42.6% |
119.9% |
NA |
113.7% |
NA |
72.3% |
NA |
145.6% |
NA |
* The models in the table are for the conflict levels defined as: 1. Total conflicts; 2. Conflicts with conflict speed > 15 km/h; 3. Conflicts with conflict speed < 15 km/h; 4. Conflicts with T2 < 2 s and conflict speed > 15 km/h; 5. Conflicts with T2 < 2 s and conflict speed < 15 km/h; 6. Conflicts with 2 s < T2 < 2.5 s and conflict speed > 15 km/h; 7. Conflicts with 2 s < T2 < 2.5 s and conflict speed > 15 km/h; 8. Conflicts with 2.5 s < T2 < 3 s and conflict speed > 15 km/h; 9. Conflicts with 2.5 s < T2 < 3 s and conflict speed < 15 km/h.
** NA signifies that the parameter was not included in the model since it was not found to be statistically significant and as such no associated effect could be calculated for that model.
*** Although the right turn lane was strongly associated with increased conflict frequency, manual review of the conflicts gives the impression that there is a higher degree of control and awareness by involved parties and the authors are not implying that it is unsafe to have a right turn lane adjacent to a bicycle lane.
Equation 4 was used to calculate the effect of increasing the right turning vehicle volume or the bicycle volume by 10% as follows:
where —the estimate of the coefficient of the right turning vehicle volume/bicycle volume.
The effect of increasing the other quantitative independent variables such as bicycle exposure length, advanced stop line length and lateral offset depends on the original value of those variables. The effect of a 10% increase in those values can be represented by Equation 5:
where —the coefficient of the quantitative independent variable;
X—the original value of the quantitative independent variable.
The effects estimated from Equation 4 and Equation 5 are illustrated in Table 6. Since the original value of a variable influences the magnitude of the effect that changing that variable would have on the predicted conflicts (as shown in Equation 4), the average values for the variables were used for the calculations. These average values are as follows:
-
Average right turn speed—17.5 km/h
-
Bicycle exposure length—12.7 m
-
Advanced stop line—2 m
-
Lateral offset—1 m.
|
Parameter |
Average associated effect on conflicts** |
||||||||
|---|---|---|---|---|---|---|---|---|---|
|
Model 1 |
Model 2 |
Model 3 |
Model 4 |
Model 5 |
Model 6 |
Model 7 |
Model 8 |
Model 9 |
|
|
Bicycle exposure |
6.3% |
NA |
NA |
NA |
NA |
NA |
NA |
NA |
NA |
|
Advanced stop line |
1% |
1.6% |
NA |
NA |
NA |
NA |
NA |
NA |
NA |
|
Lateral offset |
NA |
-2.1% |
-9.2% |
-3.8% |
-5.6% |
NA |
-2.5% |
NA |
1.1% |
|
Lateral offset x Ln (bicycle volume) |
NA |
NA |
1.6% |
NA |
NA |
NA |
NA |
NA |
NA |
|
Average right turn motor vehicle speed |
NA |
28.4% |
NA |
29.3% |
NA |
30.5% |
AN |
28.6% |
NA |
|
10% increase in right turn vehicle volume |
6.2% |
4.1% |
7.3% |
2.4% |
4.4% |
3.9% |
7.1% |
3.9% |
8.4% |
|
10% increase in bicycle volume |
11.6% |
13.9% |
10.3% |
13.3% |
7.4% |
13.3% |
10.5% |
14.4% |
12.4% |
* The models in the table are for the conflict levels defined as: 1. Total conflicts; 2. Conflicts with conflict speed > 15 km/h; 3. Conflicts with conflict speed < 15 km/h; 4. Conflicts with T2 < 2 s and conflict speed > 15 km/h; 5. Conflicts with T2 < 2 s and conflict speed < 15 km/h; 6. Conflicts with 2 s < T2 < 2.5 s and conflict speed > 15 km/h; 7. Conflicts with 2 s < T2 < 2.5 s and conflict speed > 15 km/h; 8. Conflicts with 2.5 s < T2 < 3 s and conflict speed > 15 km/h; 9. Conflicts with 2.5 s < T2 < 3 s and conflict speed < 15 km/h.
** NA signifies that the parameter was not included in the model since it was not found to be statistically significant and as such no associated effect could be calculated for that model.
Based on the results summarized in Table 4, various observations of potential interest can be made. As is evident, an increase in right hook vehicle-bicycle conflicts is generally associated with the presence of a dedicated right turn lane on the left of a bicycle lane, having a downgrade on the approach to an intersection, having a constant or increasing lateral offset on approach to an intersection, not having any pavement markings, and increasing the right turning vehicle volume and bicycle volume. An increase in lateral offset is associated with a lower number of right hook conflicts.
Discussion
When looking at total conflicts (Model 1), bicycle exposure length, having a dedicated right turn lane, and increasing the right turning vehicle volume or the bicycle volume were all noted to be associated with an increase in the right turning conflicts observed and in general the effects were found to be significant at a level of 5%. Having a flat or uphill approach grade to the intersection, in comparison to having a downward approach grade, was associated with a decrease in the number of conflicts that was significant at a 10% level. Some factors, such as having an advanced stop line for vehicles adjacent to a bicycle lane, were not found to be significant at a 5% level; however, their significance level was such that it can be reasonably assumed that they have an influence on the number of total conflicts observed.
When looking at various attributes and their effects at different conflict severity levels (as categorised by various ranges of T2 and right turning vehicle speed) the following observations can be made:
-
Average right turn speed was found to have a significant association with conflicts where the vehicle speed is greater than 15 km/h as indicated in Table 6 for models 2, 4, 6 and 8; however, it is not significant in less severe conflicts represented in models 3, 5, 7 and 9, which seems intuitive.
-
Larger lateral offsets are associated with a decrease in observed conflicts as indicated in Table 6 by models 2, 3, 4, 5 and 7. Results for how this effect changes with conflict severity levels are mixed, but it generally appears as though larger lateral offsets at slower speeds are associated with a greater reduction in conflicts. One possible explanation is that a larger lateral offset allows a right turning vehicle more reaction time as the distance between the bicyclist's path through the intersection and the right turning vehicle's path is larger. Additionally, the larger lateral offset may improve the driver's ability to perceive cyclists due to the change in the driver's line of sight while turning, in relation to the bicyclist's path through the intersection.
-
Not having a downgrade on approach to an intersection is associated with larger decreases in conflict frequency at higher severity levels classified by lower T2 values or higher right turning conflicting vehicle speed as indicated in Table 5 by comparing models 2 and 4 with models 3 and 5, respectively, and also by comparing models 2 and 4. This may be because the ability of bicyclists to slow down or stop is hindered by downhill grades, potentially resulting in more severe conflicts.
-
The presence of a dedicated right turn lane, which the data suggest is associated with an increase in observed conflicts, has an effect that is significant at higher severity levels where the conflicting vehicle speed is greater than 15 km/h as indicated in Table 4 and Table 5 by models 2, 4, 6 and 8 compared to models 3, 5, 7 and 9, respectively.
Observations 1 and 2 were made across most of the different levels of conflict severity categories; however, observation 2 is seen to be reversed in the 2.5 s < T2 < 3 s category, with an increase in lateral offset associated with an increase in conflict frequency. This apparent anomaly needs to be further explored.
Conclusions limitations, and future directions
Through regression analysis, various associations were observed in the data. In general, increased bicycle exposure length, and increased right turning vehicle volume or bicycle volume, were all noted to be associated with an increase in the right turning conflicts observed. An increase in lateral offset of the bicycle facility and a flat or uphill approach grade to the intersection, were associated with a reduction in the number of conflicts observed. Previous research supports some of these observations. Although the very small increase in right turning conflicts associated with advanced stop lines seems counterintuitive, one study (Buch & Jensen, 2017) found that there was an increase in all types of right-turn collisions when a staggered stop line was used, a result that was, however, not statistically significant. In the same study, it was found that there was no safety effect at intersection arms where there was a dedicated right turn lane. One study found that failures in a driver's visual attention were common when turning at urban intersections, primarily when checking for bicyclists rather than checking for pedestrians (Kaya, 2019). This supports the suggested explanation for why increased lateral offset is associated with a decrease in conflict frequency, as it deals with the driver's visual perception. The effects associated with increasing bike exposure length and right turning vehicle volume or bicycle volume are intuitive as they all increase the opportunity for conflicts to occur. A study on advancing design practices to mitigate bicycle right hook conflicts also supports the observations made in this study in relation to factors affecting total conflict frequency (Milligan et al., 2022). These observations can be used to guide and improve the geometric design of intersections with the aim of improving bicycle safety.
Some of the limitations of this study are related to both the data set and the regression analysis. The intersections in the database used to generate conflict prediction models all had some form of bicycle infrastructure present and, therefore, it was not possible to compare the effect of having a bicycle facility present to not having a bicycle facility present. This necessitated a cross-sectional study, which is not ideal since there may be omitted or correlated variables in the models which could lead to inaccurate coefficients or even counterintuitive results. Nevertheless, corroboration of the findings with intuition and the results for other studies suggest that there is value to the cross-sectional approach used.
The data related to the video derived conflicts represents observations that were made at various times of the year. The conflicts observed at the intersections were not all observed at the same time of year, i.e., some of the intersections were observed in July and some were observed in December. The observation period was generally between July to December; however, since these observations were also done in different provinces, the weather conditions under which these observations were made might have been different. This was not considered in the regression models developed and could be a source of unaccounted heterogeneity that is, nonetheless, typical of such studies.
The intersections were also from various provinces and cities. As such, the regression models represent the average effects over the various categories of intersection in different cities since any behavioral differences between drivers at different types of intersections or in different cities could not be accounted for. Future research can address this limitation by using intersections from a specific city or province to reduce differences in driving and cycling behavior due to different practices or norms in different areas. Alternatively, approaches that incorporate behavioral variables into the prediction mechanism such as those described by Shaon et al. (2019) can be utilized.
Future research can investigate whether there is a change in the effect of bicycle volume on the frequency of conflicts as bicycle volume increases, as well as on whether the effectiveness of different bicycle infrastructure changes as the bicycle volume changes. In addition, it would be useful for such research to also validate the severity level thresholds used to determine what the best threshold values are for correlating conflicts to collisions.
Finally, although zero inflated models were not used in this study because of the focus on understanding the causes of conflicts rather than improving statistical fit for prediction purposes, measures can be taken to address the root causes of possible excess zeros such as selecting appropriate spatial and time scales or adding a term to the model to capture unobserved heterogeneity (Lord et al., 2005).
Declaration of competing interests
The authors declare that they have no known competing financial interests or personal relationships that could have appeared to influence the work reported in this paper.
Availability of data
The corresponding author can provide upon reasonable request the derived data that support the findings of this study. Raw data are available from Miovision (formerly Microtraffic) on request at https://microtraffic.com/bicycle-right-hook-conflict-study/.
Funding
This research was funded by Discovery and Alliance Grants (Appl. ID RGPIN-2017-04457 and ALLRP 566916–21) from the Natural Sciences and Engineering Research Council of Canada (NSERC). The Alliance grant partners included the City of Toronto, who provided ideas, and cash and in-kind financial contributions, and Miovision, who provided data, ideas, and in-kind financial contributions.
Several additional funding partners supported the generation of data that Miovision provided in this study; these are recognized inMilligan et al. (2022).
CRediT contribution statement
Robert Mansell: Conceptualization, Data curation, Formal analysis, Writing—original draft.
Bhagwant Persaud: Conceptualization, Supervision, Writing—review & editing.
Craig Milligan: Data curation, Writing—review & editing.
Amanda Pushka: Data curation, Writing—review & editing.